
A trend layer answers one question: where in the cycle are we. Not up or down. Not buy or sell. A market moves through phases - a bottom gets built, a trend develops, the trend loses force, a top gets built - and a trend layer is a record of which phase the chart is in right now. Everything useful about it follows from that, and most of the ways people misuse one come from asking it a question it was never built to answer.
Why “up or down” is the wrong question
Ask whether a market is going up or down and you get an argument. Ask where it stands in its cycle and you get something you can check against the chart.
The difference matters because “up” and “down” describe the last few candles, and the last few candles are the noisiest thing on the screen. A cycle is slower. A structural bottom takes time to build. A trend takes time to develop, and it usually weakens before it turns. Those phases leave marks in how price behaves - whether candles are constructive or deteriorating, whether progress is being made or defended - and that behaviour is what a trend layer reads.
So the layer is not a direction indicator in the classic sense. It does not draw a line and tell you which side you are on. It watches how the trend is behaving and marks the phase.
The five states
A trend layer that reads behaviour rather than direction ends up with a small number of states. Ours has five, and they are read against price - marks sit below the candles or above them, and the colour and intensity of the marks carry the reading.
Intense green below the bars. A structural bottom is being built. This is the state most tools miss, because it appears while price is still low and the chart still looks broken. The layer is not saying the low is in. It is saying the behaviour under price has turned constructive enough that a bottom is being constructed.
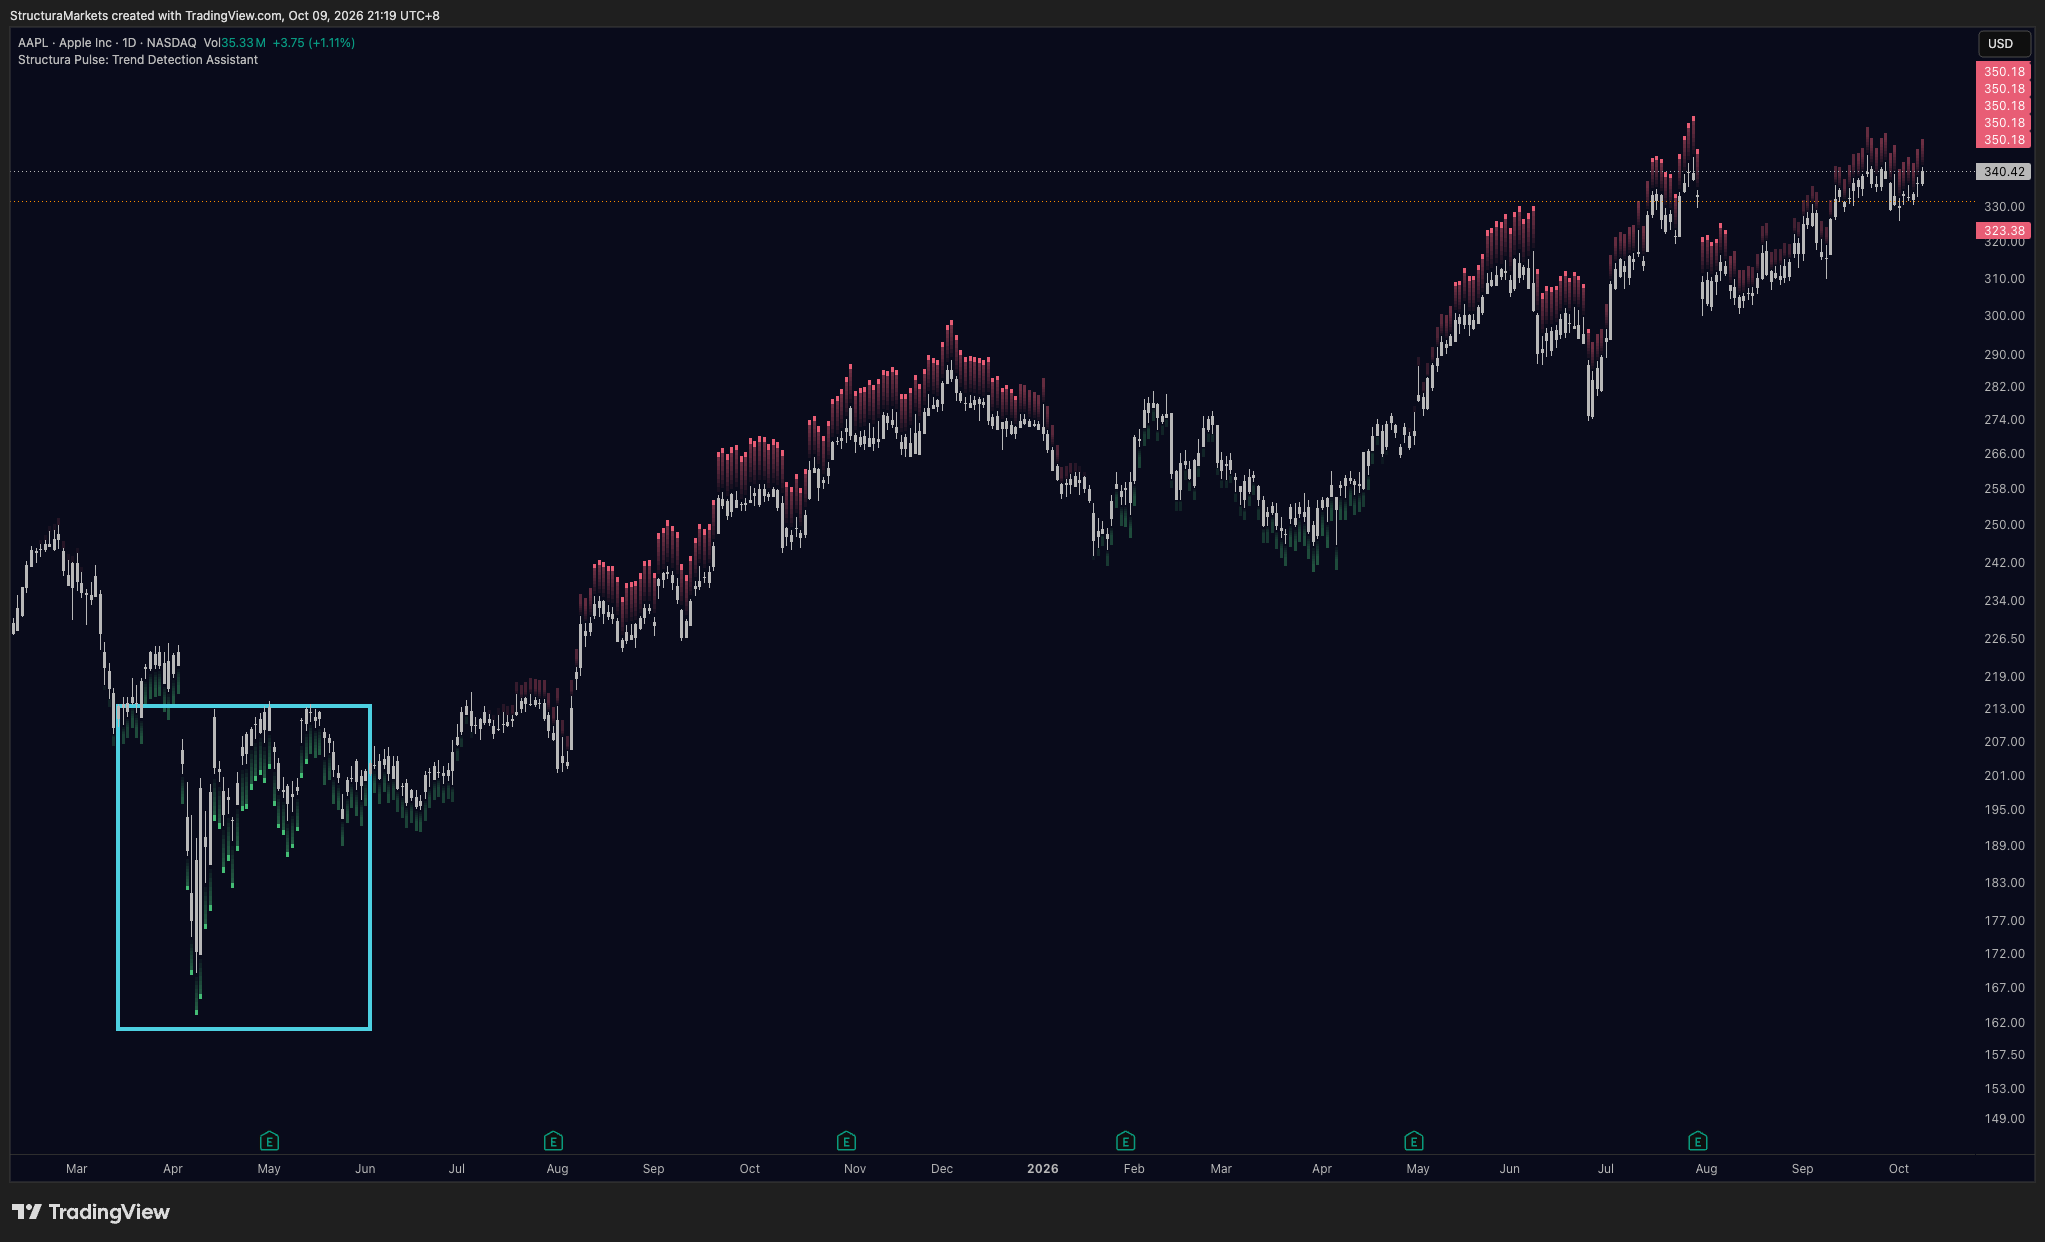
Green below. The bottom is in and the trend is turning up. The marks are lighter now. The construction phase is over and the market has started to make progress away from it.
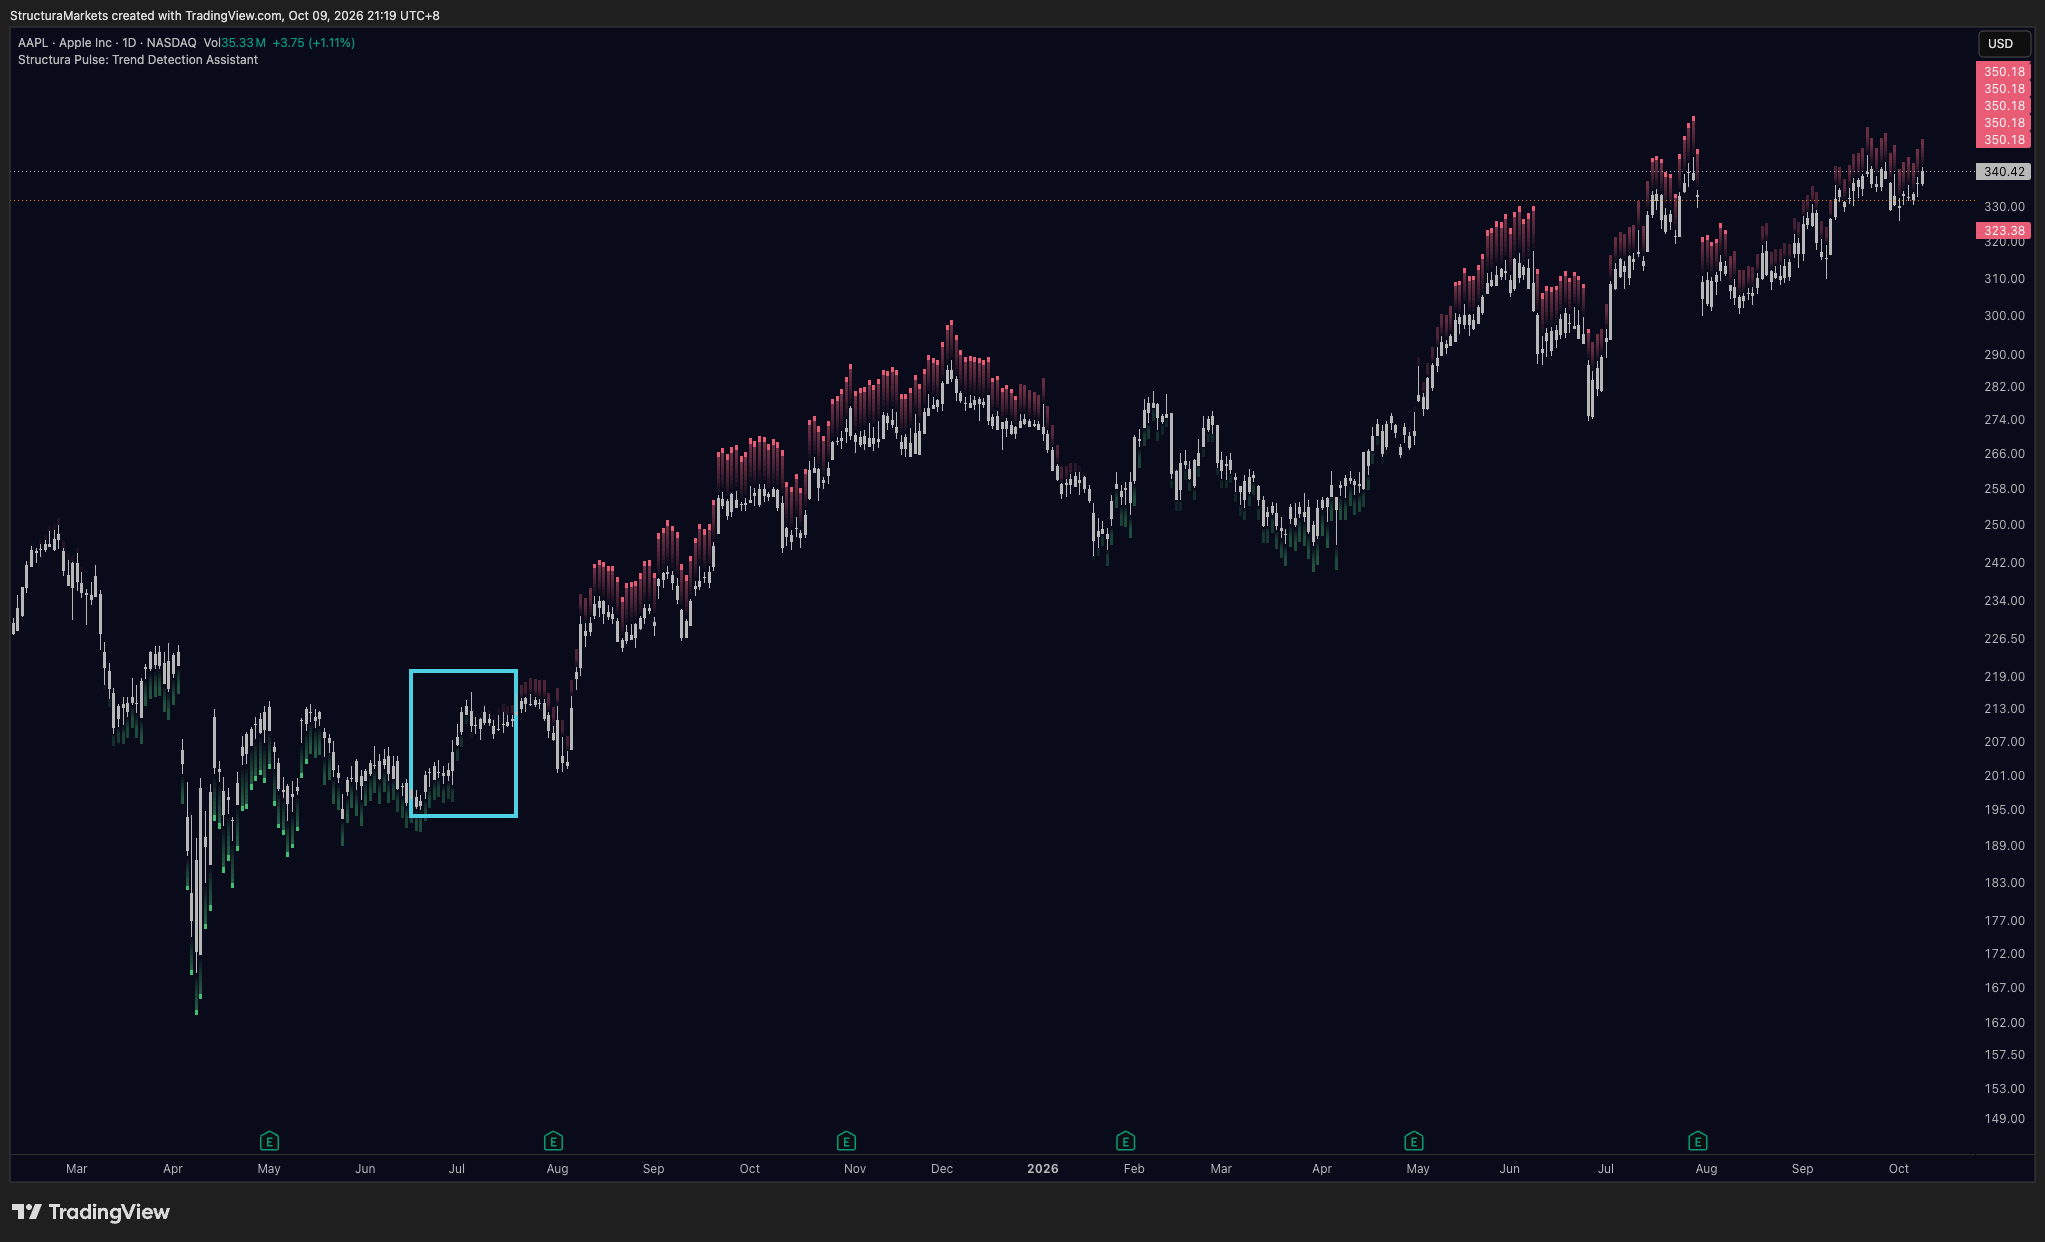
No marks at all. The trend is developing. This is the state people worry about most, because a tool that shows nothing looks like a tool that is broken. It is the opposite. When the trend is simply doing its job, there is nothing to mark. The silence is the point.
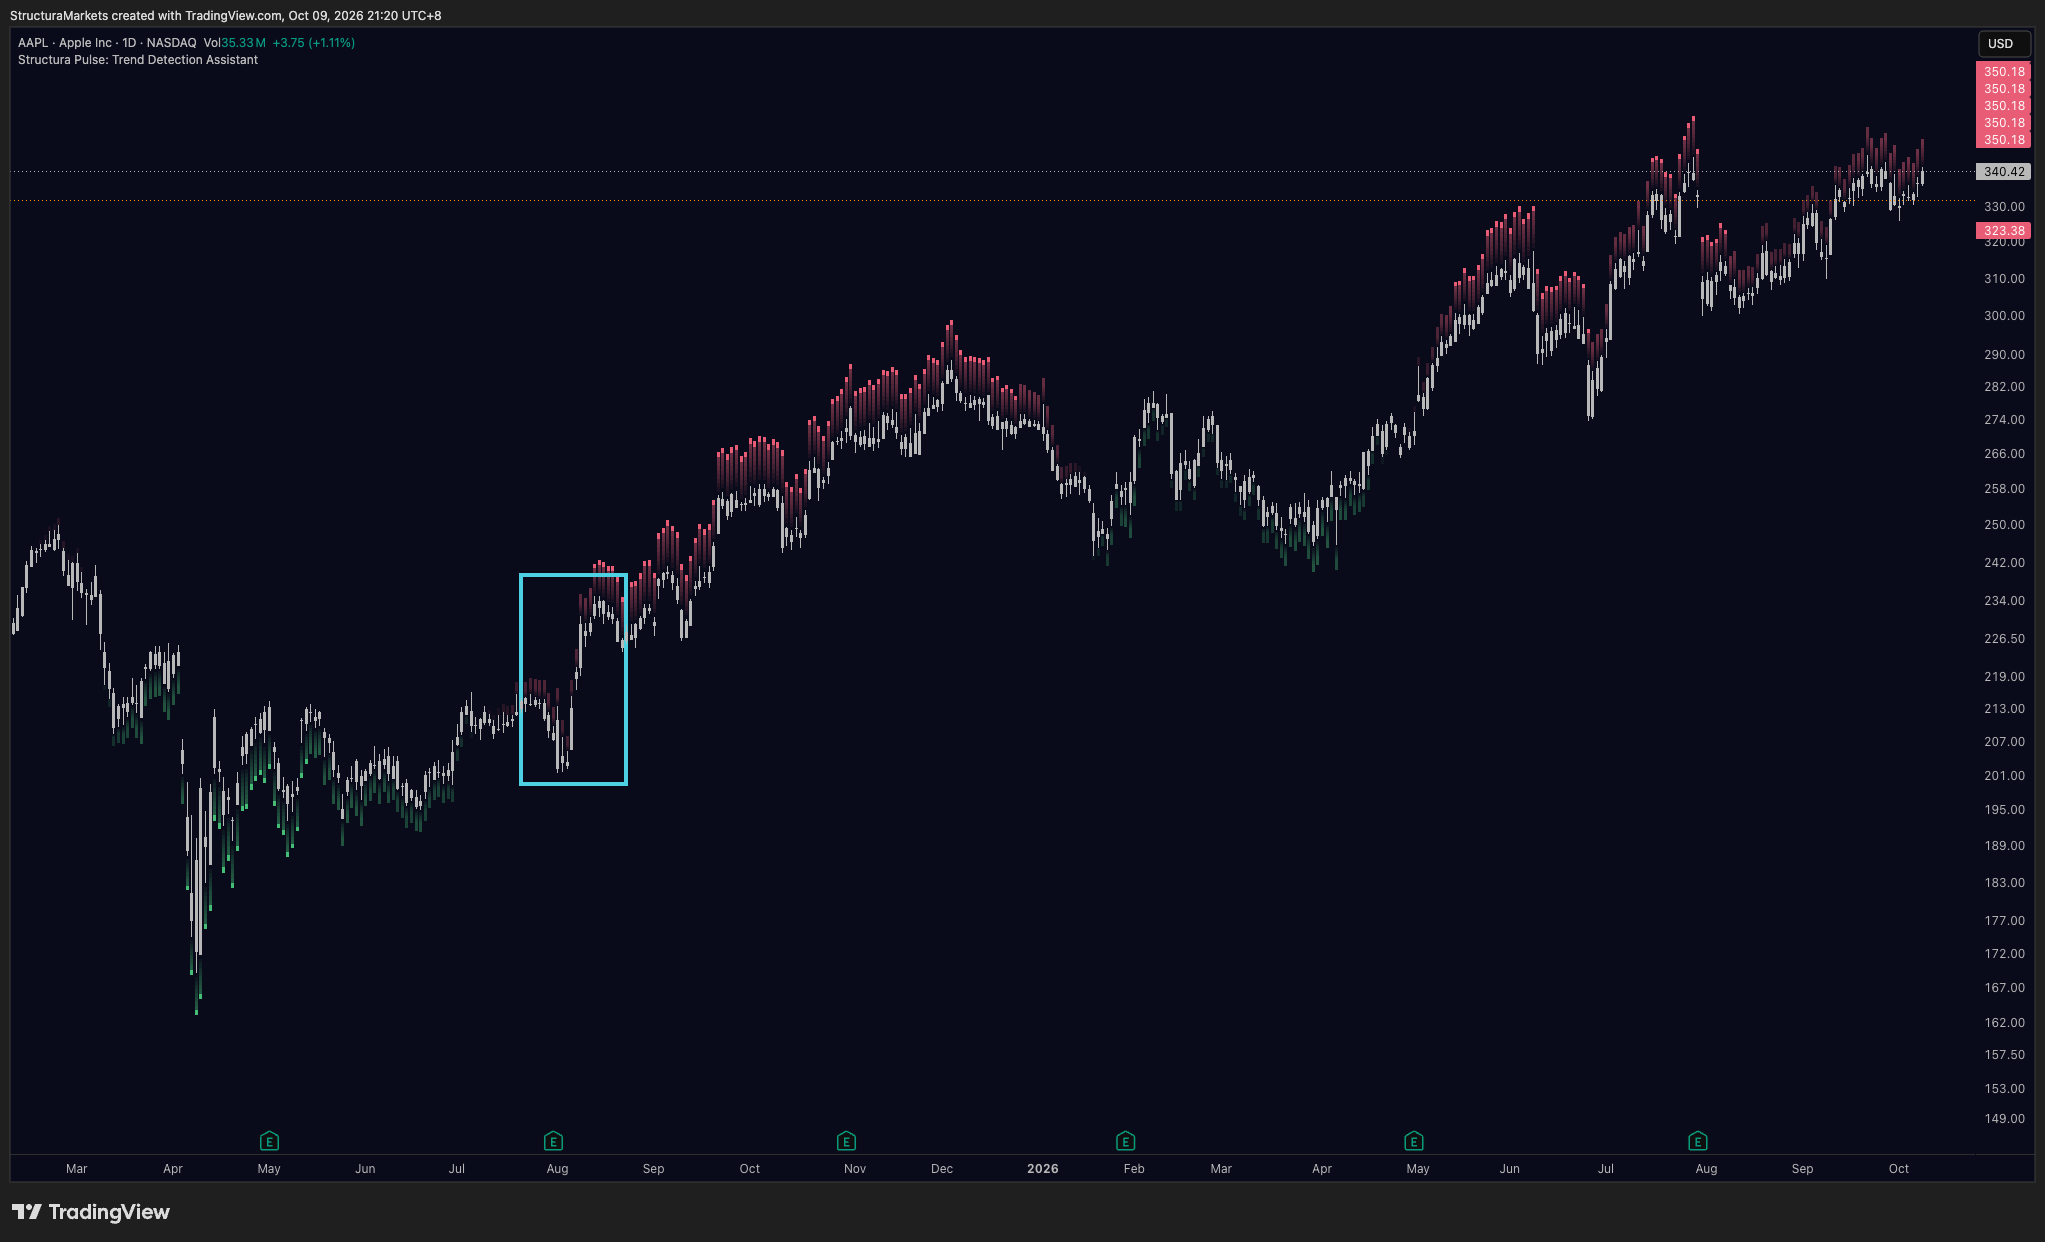
Red above the bars. First signs of the trend losing force. Price may still be making progress - often it is - but the behaviour underneath has started to deteriorate. This is a description of the trend’s condition, not a call on its end.
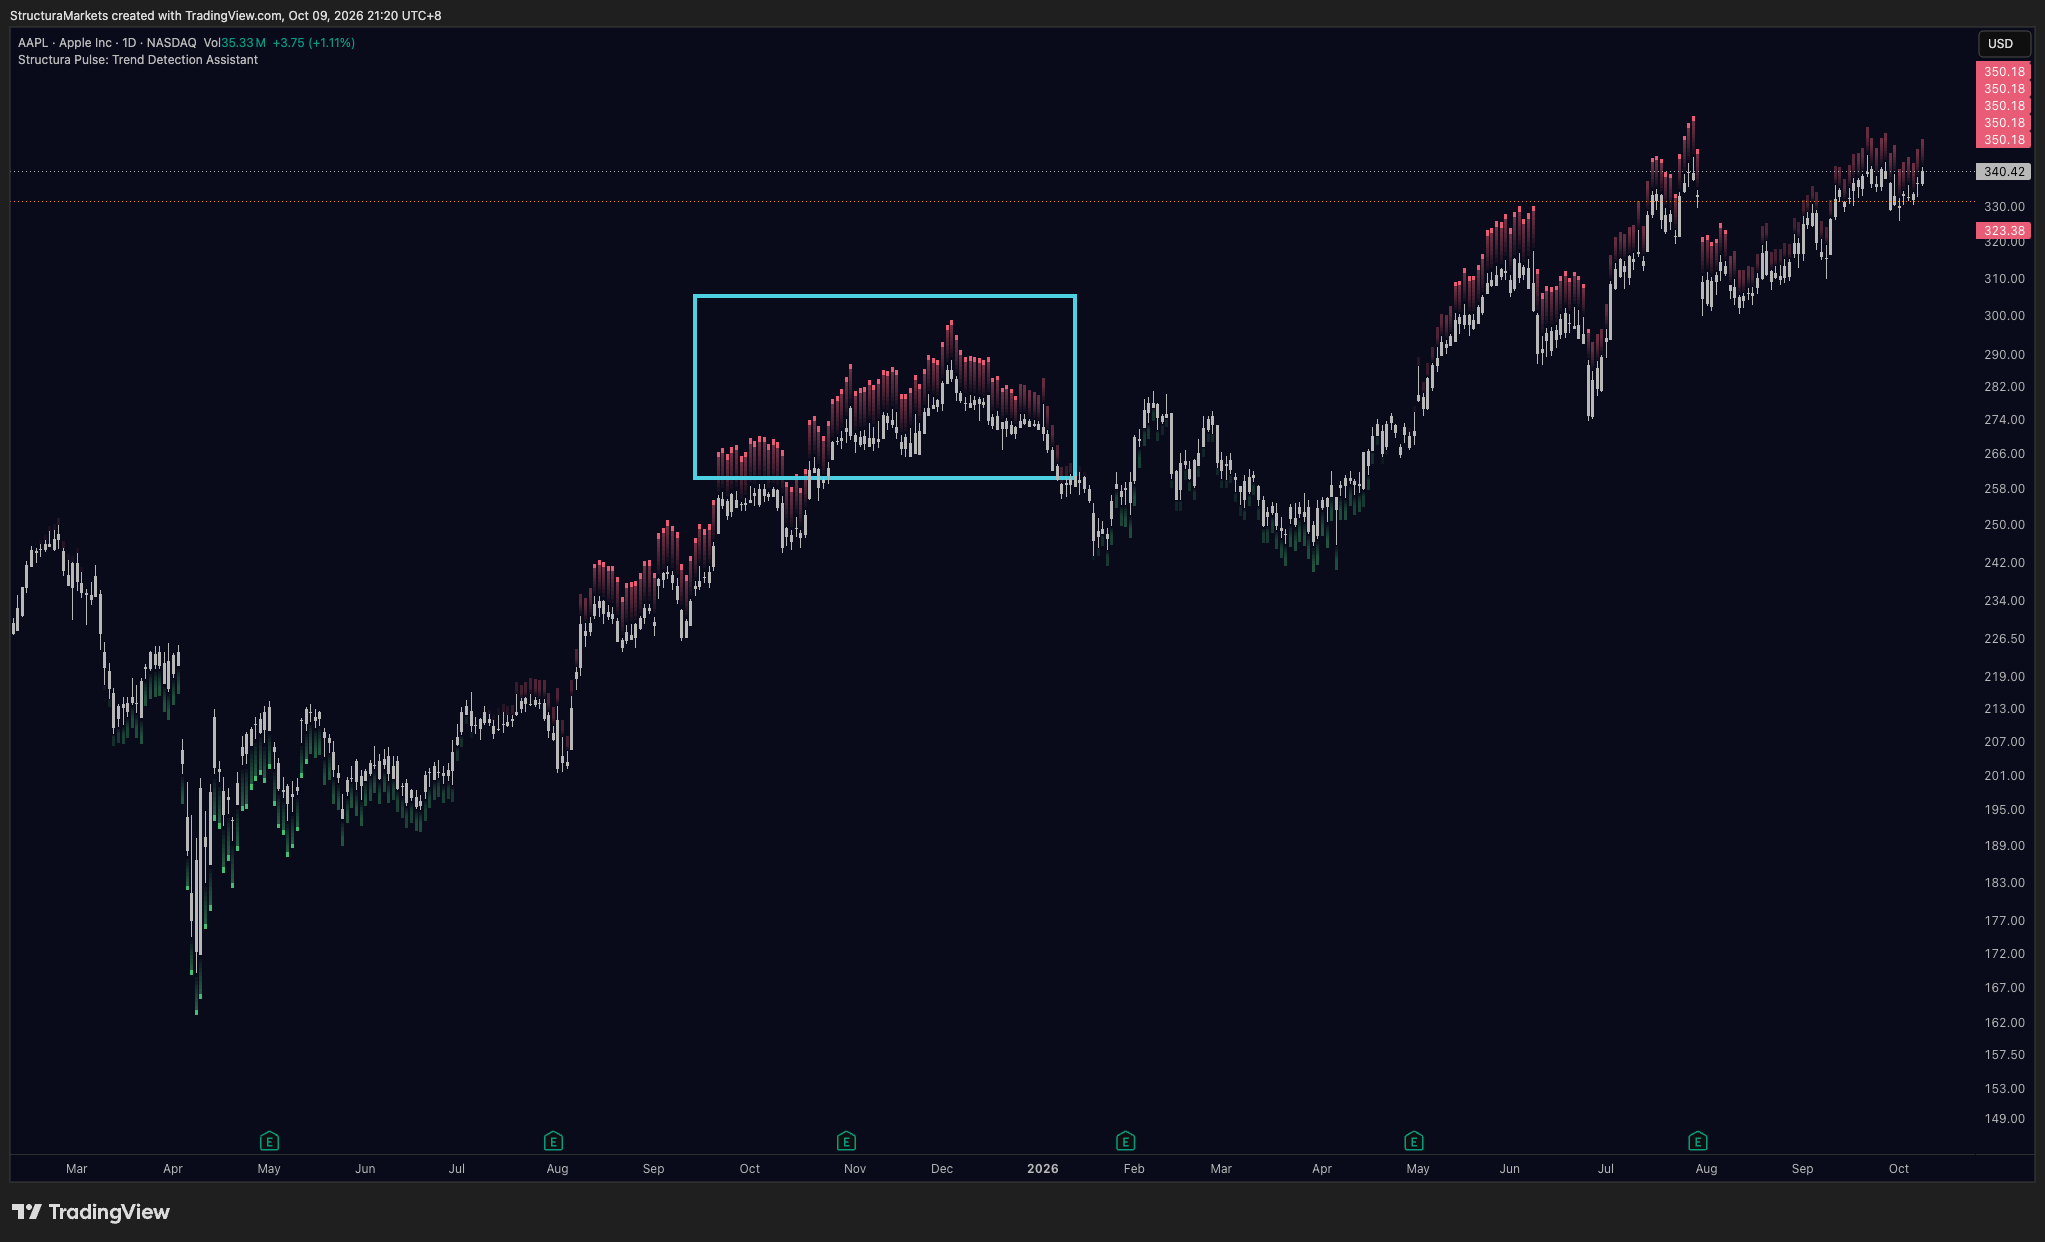
Intense red above. Structural-top territory. The deterioration has become dense enough that the layer reads the phase as one where tops get built. Nothing about this says the top is in. It says this is the part of the cycle where you review the chart more carefully than you did during the silence.
Five states, one cycle. The layer walks through them in order more often than not, but it does not have to, and a market can sit in one state for a very long time.
What the layer does not say
This is the part worth reading twice.
The layer does not say the trend will continue. A long silence is a record of a trend that has been developing, not a promise that it keeps doing so.
The layer does not say the top is in, or the bottom. Intense red is a phase, not a date. Intense green is a phase, not a date. Markets spend time in both before anything resolves, and sometimes they leave the phase without resolving at all.
The layer does not time entries or exits. A mark is never a buy or a sell. Reading “structural-top territory” as “sell” is turning a description into an instruction, and the layer did not give one.
How it sounds when it is wrong
Every trend tool has a stretch where it looks wrong, and the honest thing is to show it rather than hide it.
A trend layer that reads behaviour will mark red above price while price keeps going up. It can do this for months. In a strong move, the trend’s behaviour can deteriorate - progress gets harder, candles get more defensive - long before price stops making highs. The layer records the deterioration when it sees it. It does not wait for price to agree.
That stretch is where most people give up on the tool, and it is the stretch the tool is built for. A layer that only turned red once the top was obvious would be a layer that told you nothing you could not see yourself. The cost of reading behaviour early is looking wrong for a while. The cost of reading it late is not reading it at all.
The same is true at the bottom. Intense green under a chart that is still falling looks like a mistake. It is the layer describing construction while the construction is still ugly.
How to read one without predicting
The discipline is the same as with any structure layer. Describe, do not decide.
First, name the state. Which of the five is the chart in? That is a fact, and it is where every reading starts.
Second, name the time. How long has the chart been in that state? A week of red above price and six months of red above price are different records, and the layer shows both without comment.
Third, watch transitions as questions. When the marks change - green fades to silence, silence turns to red - the question is whether the new state holds. The layer will show you, after the fact, whether it did. It will not tell you in advance.
Fourth, read it next to something independent. A trend layer reads behaviour. A momentum layer reads something else, and a structure layer reads something else again. When they land in the same place - a structural bottom marked by the trend layer while momentum reads washed out and a structure zone has opened underneath - that is three separate readings agreeing, and it is a different kind of record than any one of them alone. That is not a prediction either. It is confluence, and confluence is checkable. When the layers disagree, the disagreement is information too.
Four common mistakes
Reading a mark as a signal. Marks describe a phase. The decision is yours, and the layer takes no part in it.
Reading silence as failure. No marks means the trend is developing. A tool that is quiet when there is nothing to say is working.
Judging the layer by the stretch where it looked wrong. Find the months where red sat above a rising market. That is the layer reading behaviour before price confirmed it. Discarding it for that is discarding it for doing its job early.
Using it alone. One layer is one axis. The trend layer tells you the phase. It cannot tell you whether momentum or structure agree, and the disagreement, when it comes, is the information.
How we mark it
Structura’s trend layer is called Pulse. It draws five states against price - green marks below the candles where behaviour turns constructive, red marks above where it turns deteriorating, intensity carrying how dense the reading is - and it leaves the chart alone when the trend is simply developing. It does not fire entries, it does not redraw what it marked, and it will sit above price for months looking wrong when the behaviour underneath has changed before price has.
We read it next to the momentum layer and the structure layer, and we treat all three agreeing as the record worth noting. We do not publish what is inside it. The reading is the state, the time spent in it, and whether the other layers agree - and that is enough to describe where a market stands in its cycle without pretending to know where it goes next.
Common questions about trend layers
Is a trend layer the same as a moving average?
No. A moving average tells you which side of an average price is on. A trend layer that reads behaviour tells you which phase of the cycle the market is in. The two can disagree for a long time - price well above its average while the trend layer already reads deteriorating behaviour - and that disagreement is useful rather than a contradiction.
Does red above price mean the trend is over?
No. It means the trend’s behaviour has started to weaken. Trends often make further progress in that state. Whether it ends is answered later, by how long the state holds and whether it deepens.
Why does the layer show nothing for long stretches?
Because the trend is developing and there is nothing to mark. A tool that filled the silence would be inventing readings. The silence is a state, and it is the one you want to see most of the time.
Can a trend layer be used on any timeframe?
Yes, and the timeframes will disagree. A daily chart can read structural-top territory while the weekly still reads a developing trend. That is not an error. It is two clocks, and the slower one is the context for the faster one.
Is a trend layer a trading signal?
No. It is a description of where the market stands in its cycle. What anyone does with that description is a separate decision, and the layer makes no part of it.
Educational market commentary - not financial advice.
Read us first in your Google results:
Free on TradingView
Get the free structure layer.
Structura Accumulate marks where the market may be rebuilding structure before the move becomes obvious.
Get the free structure layer