
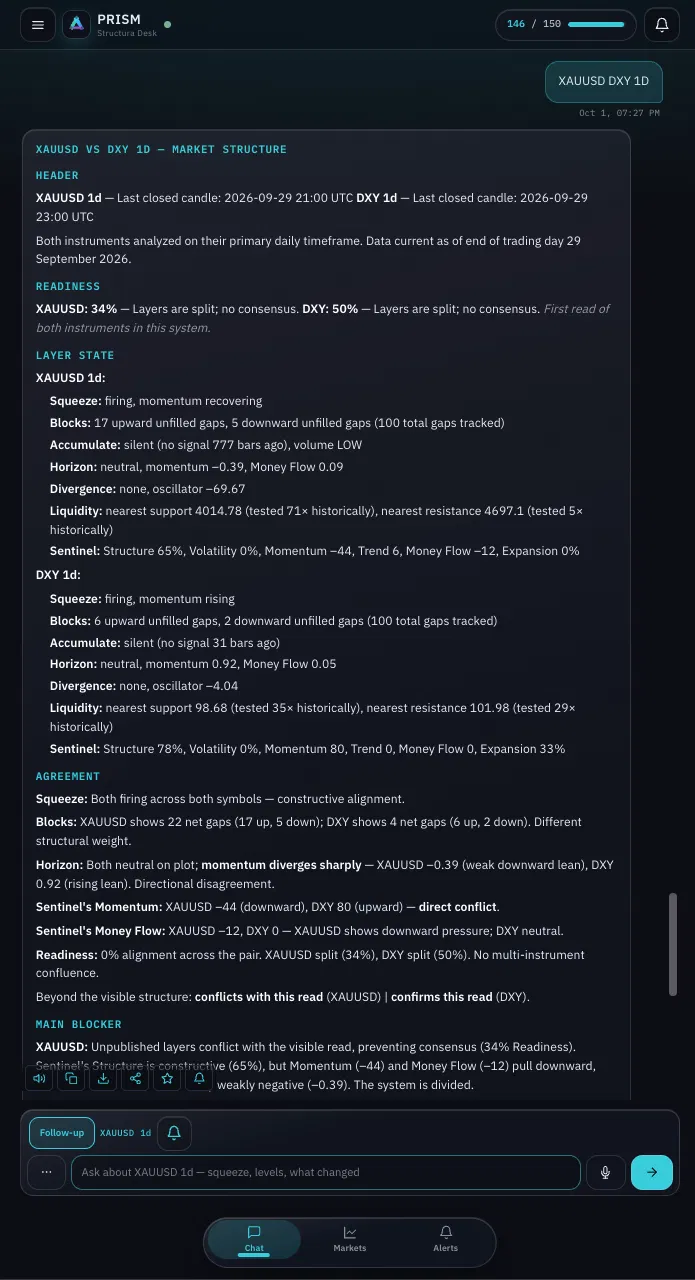
Yes - but what it reads decides what it can say. Most "AI chart analysis" today works the same way: you upload a screenshot, a language model looks at the pixels, and it tells you what it sees. It is a genuinely useful trick for a few things. It is also the reason most AI chart reads sound confident and mean very little. This article is about the difference between an AI that reads a picture and an AI that reads structure, using one real read as the example - including the parts where it is unsure, and one where it is plainly wrong.
What a screenshot AI actually sees
A screenshot is a picture of a chart, not the chart. When a model is handed an image, it is doing recognition: those bars go up and to the right, that line looks like support, this shape resembles a wedge. It has no access to the data underneath - no volume, no history beyond the frame, no idea what the indicators on screen are measuring or what their scale is. It is pattern-matching against everything it has ever seen described as "bullish" or "bearish" and producing the most plausible sentence.
That is why these reads tend to converge on the same output: a trend call, two or three levels read off the axis, and a confidence level the model has no way to justify. It is not lying. It is describing a photograph.
The second problem is subtler. A screenshot AI sees only what you chose to show it. Crop the chart to the last three months and the "obvious uptrend" appears. Zoom out two years and it disappears. The read changes with the framing, and the model cannot tell you that, because it does not know what was left out.
What a structure read looks like
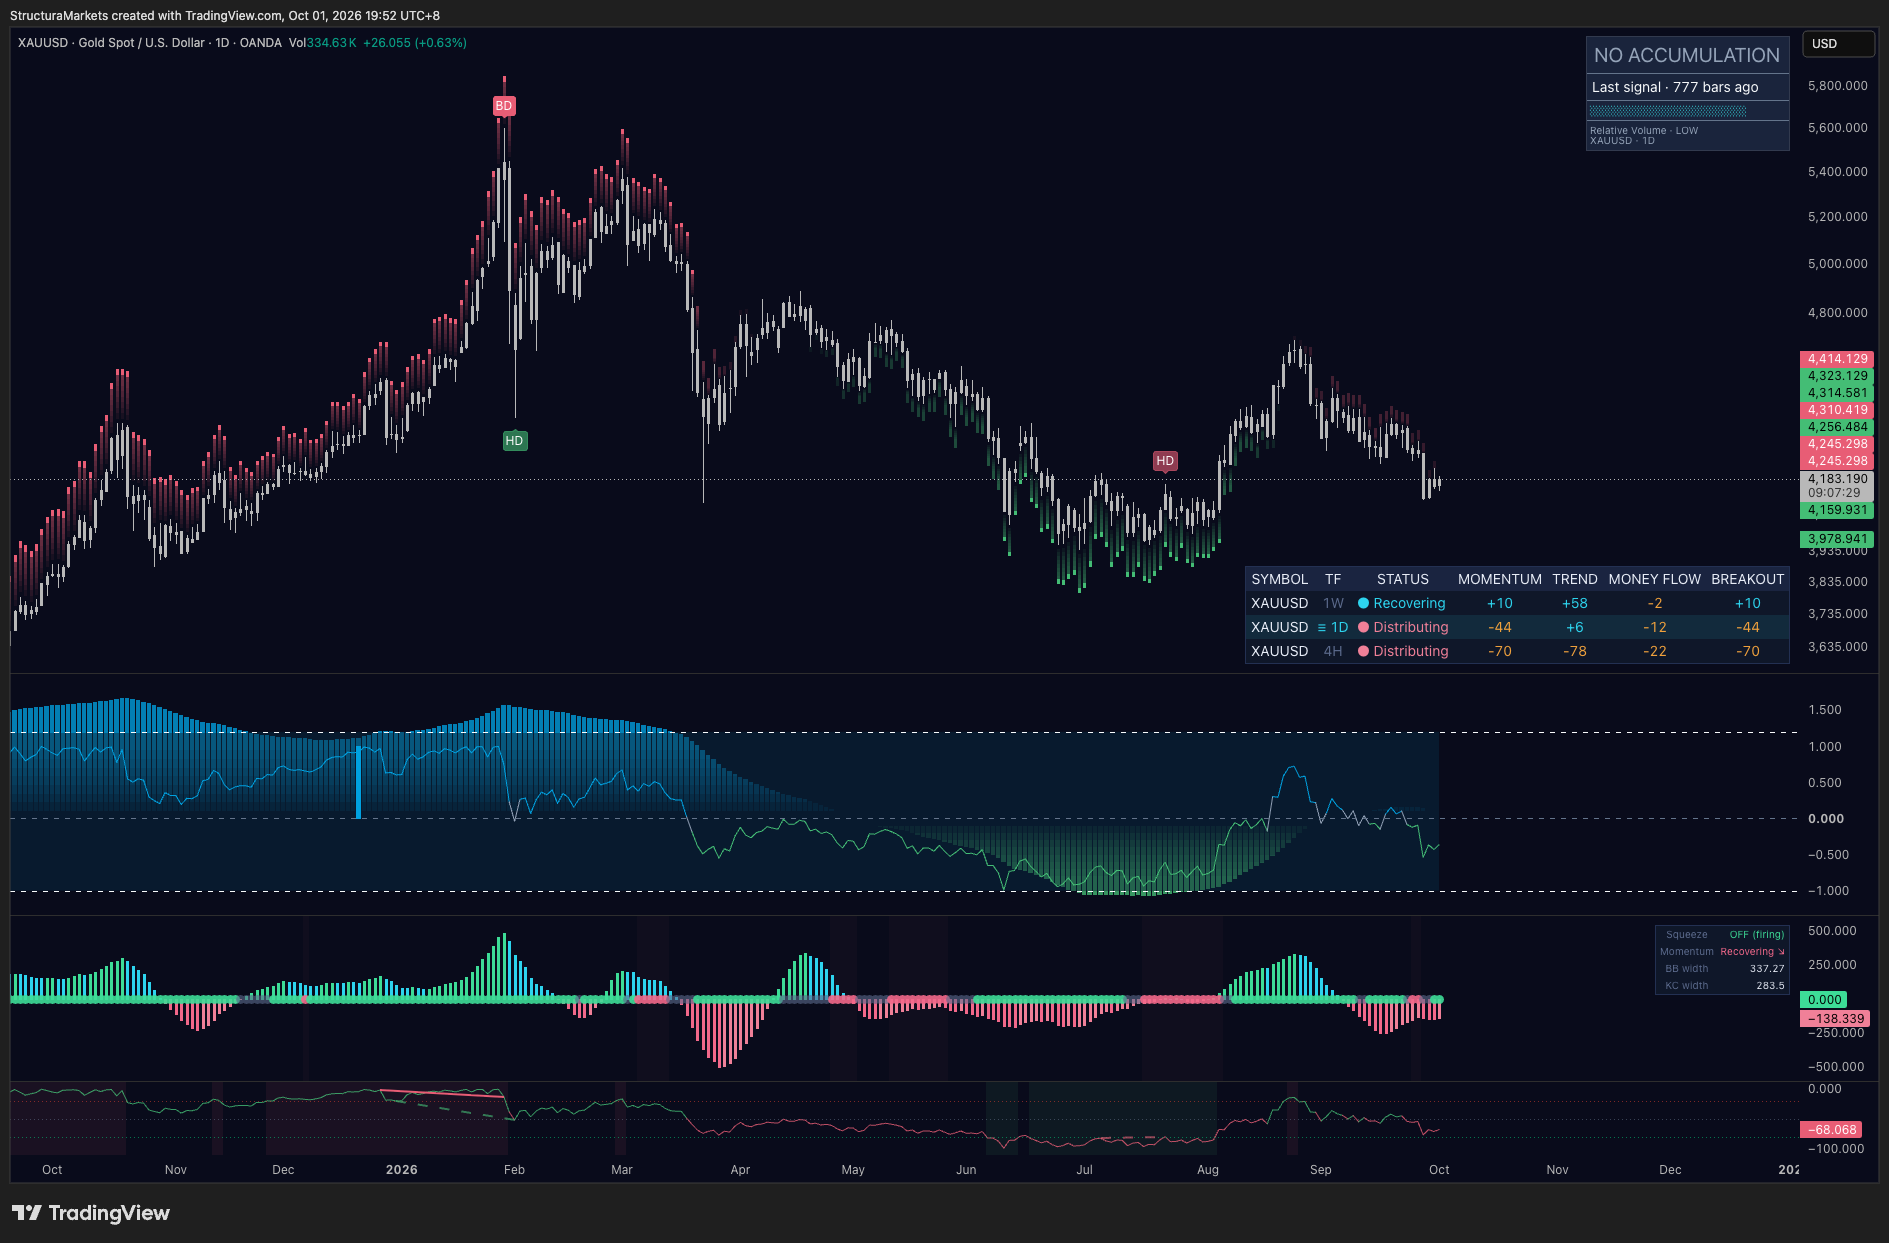
A structure read starts with layers, not pixels. Instead of looking at an image, the AI is given the state of several independent measurements of the same market - each answering a different question. Where has price been accepted and built a base? How much force is behind the move? Is the move being paid for by participation? Where did price leave gaps behind? Where does the market keep testing the same levels?
The free layers are listed, with what each one does not read, in our guide to free TradingView indicators for market structure.
Those questions are independent on purpose. When all of them agree, the market is usually already understood and there is not much to say. The information sits where they disagree - and a read that can name the disagreement is a different kind of read from one that averages everything into "bullish".
Here is what that looks like in practice.
One read, two instruments
On 30 September we asked Prism, our AI assistant, to read gold and the dollar index together on the daily. Not "is gold going up" - just: which layers agree, which disagree, which are silent, and what would have to change.
The first thing it did was refuse to pick a side on gold:
XAUUSD: 34% - Layers are split; no consensus.
Then it said why. The structural layer had been silent for a long time - no accumulation signal in 777 bars, on low volume. Momentum read weak: Horizon slightly below zero, the scanner's momentum column at -44, money flow at -12. The gap layer showed far more unfilled gaps above price than below. A compression layer was firing with momentum recovering. And the layers it reads that we do not publish pulled the other way from the visible ones. Its conclusion:
The system is divided.
On the dollar, the same question got a different answer. Momentum strong on every clock it checks, the unpublished layers confirming rather than conflicting, and a readiness of 50% - still not consensus, but for a different reason:
Readiness is split (50%) only because no consensus threshold is met, not because of layer conflict - the direction is clear.
And across the pair:
Readiness: 0% alignment across the pair. XAUUSD split (34%), DXY split (50%). No multi-instrument confluence.
Notice what is not in any of that. No target. No "buy gold" or "short the dollar". No probability of a reversal. What it produced instead is a map of agreement - this layer says this, that one says the opposite, this one has nothing to say - and a list of conditions that would change the map:
Would strengthen the read: Horizon momentum moves above 0. Sentinel's Money Flow turns positive. Close holds above nearest support 4014.78.
That last part is the point. A screenshot AI gives you a conclusion. A structure read gives you a protocol - what you would need to see to believe it more, and what would tell you it was wrong.
Why the input matters more than the model
The language model inside both approaches might be the same. The difference is what it is handed. Give a model a picture and the best it can do is describe the picture. Give it the state of seven layers, each with a defined meaning and a defined scale, and it can do something a picture never allows: compare them.
This is also why "just paste the chart into ChatGPT" has a ceiling. The chart you paste contains the output of your indicators, not their logic. The model does not know that one line on screen measures force and another measures participation, or that the two are supposed to diverge sometimes and that the divergence is the information. It sees two lines.
A structure read also has memory that a screenshot does not. "No accumulation signal in 777 bars" is a fact about three years of history. "Nearest support tested 71 times" is a fact about how the market has treated a level, not how it looks today. Neither is visible in a picture.
What an AI chart read will not do - any of them
This is the part most of the tools on the first page of Google leave out, so we will not.
It will not tell you what happens next. Prism reads the present. "Layers are split" is a description of today. Tomorrow's bar is not in the data, and no honest read pretends otherwise. If an AI tool gives you a direction with a percentage attached, ask where the percentage came from.
It will not make the decision. The read above ends with conditions, not instructions. Whether a divided system is a reason to wait, to size down, or to do nothing is yours to decide. The tool's job is to make the present legible, not to replace judgment.
It is only as good as the layers it reads. When a layer is wrong or its data is thin, the read inherits that. Low volume on gold made the structural layer's silence less informative, and Prism said so. It cannot read what the layers do not measure.
It will sometimes produce a number that makes no sense. In the same read, among the conditions that would weaken the gold read, Prism listed a close above 5,768 - a level roughly 38% above where gold was trading and above anything the chart had ever printed. Technically consistent with its own logic; practically useless. We are leaving it in this article because it is exactly the kind of thing a reader should be able to catch, and because a tool that only shows you its best outputs is not a tool you can calibrate against.
It will not replace looking at the chart. A read is a second opinion that happens to be fast and to never get tired. It is a reason to open the chart, not a reason to close it.
How to tell the two kinds of tool apart
Three questions, before you trust any AI chart analysis:
Does it tell you what it is reading? Not "the chart" - which measurements, on what scale, over how much history. If the answer is "the image you uploaded", you know what you are getting.
Can it disagree with itself? A read that always arrives at one direction is averaging, not analysing. The useful ones can say "these two layers conflict and here is why".
Does it say what would change its mind? A conclusion without conditions is an opinion. A read with conditions is something you can check next week - and that is the only kind worth paying attention to.
Where this leaves gold and the dollar
Nowhere in particular, which is the honest answer. Gold's layers are divided; the dollar's point one way without consensus; the pair shows no confluence. What the read gave us is not a trade. It is a short list of things to watch - momentum back above zero, money flow turning, a support level holding - and the knowledge that until some of those move, the system has not made up its mind.
An AI that can say "I don't know yet, and here is what would change that" is doing something a screenshot never will.
Educational market commentary - not financial advice.
Read us first in your Google results:
Free on TradingView
Get the free structure layer.
Structura Accumulate marks where the market may be rebuilding structure before the move becomes obvious.