
Structura tools
Pulse
Pulse detects changes in trend behavior by visualizing constructive or deteriorating market behavior directly on price.
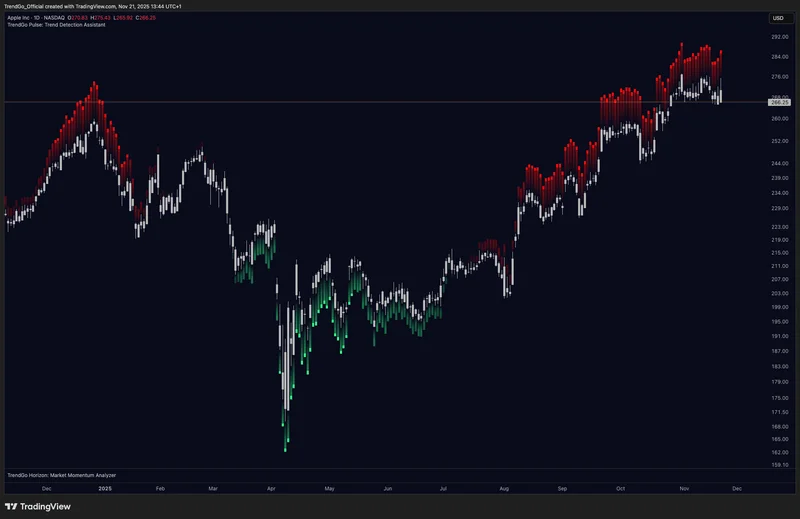
What it reads
- price behavior relative to recent market structure
- trend participation
- volatility-adjusted behavior
- constructive vs deteriorating candle behavior
- continuation vs weakening conditions
What it shows
- green dots below candles
- red dots above candles
- areas where trend behavior starts improving
- areas where trend behavior starts deteriorating
How to read it
- Green dots under candles = constructive trend behavior.
- Red dots above candles = deteriorating / defensive trend behavior.
- Green dots appearing after Accumulate + Horizon recovery = stronger confirmation of transition.
- Red dots after extended move = possible trend exhaustion or distribution behavior.
What it will not do
- Pulse is not a standalone entry signal. It is a trend behavior confirmation layer.
Where it sits in the system
How to get it
Horizon, Pulse and every free layer