
Sunday Read #10 · One layer at a time · 05 Prism
On Wednesday we asked an AI about gold. Not where it was going - just which layers agree, which disagree, which are silent, and what would have to change.
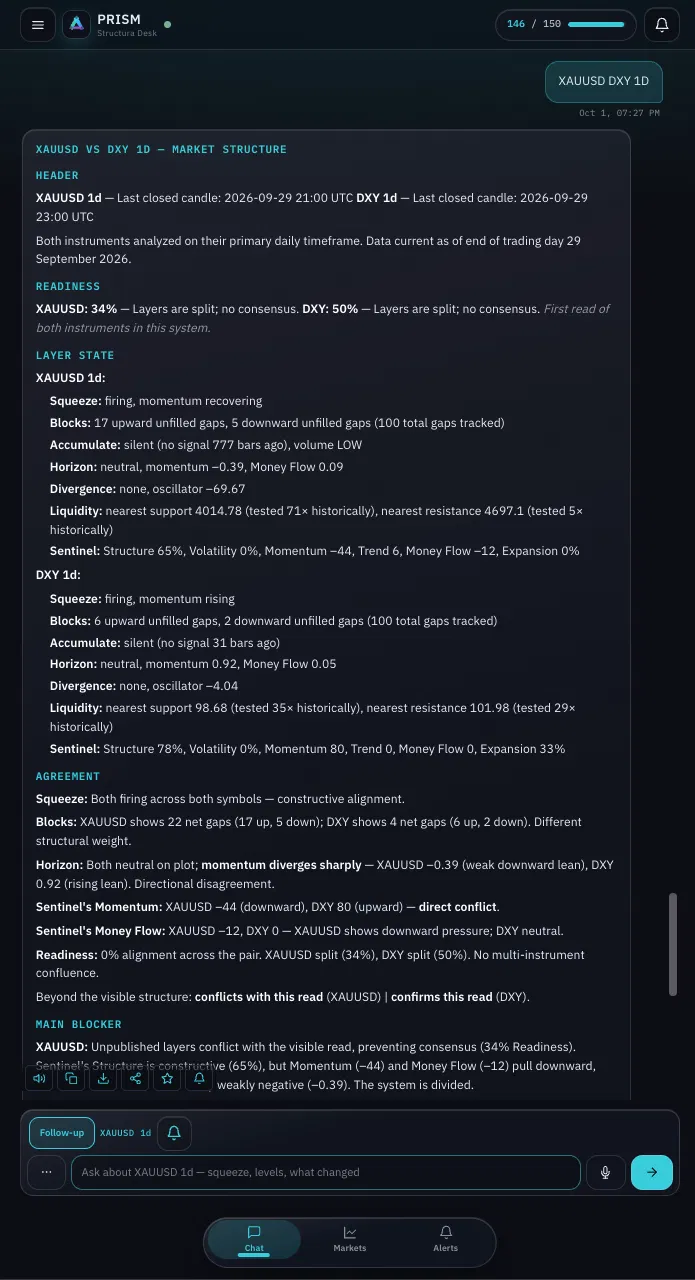
The first thing it said: "Readiness 34%. Layers are split. No consensus."
An AI that was asked about gold, and the first thing it did was refuse to pick a side. Most AI chart tools cannot do that. This one does it by design. This episode is about why.
Fifth in the run - and not a layer
Divergence, Accumulate, Blocks, Horizon: one layer at a time, three questions of each. Prism is different, because it is not a layer. It is the thing that reads all of them. Same three questions: what does it read, what does it refuse to say, and what does it sound like right now.
What it reads
Start with what it does not read: a picture.
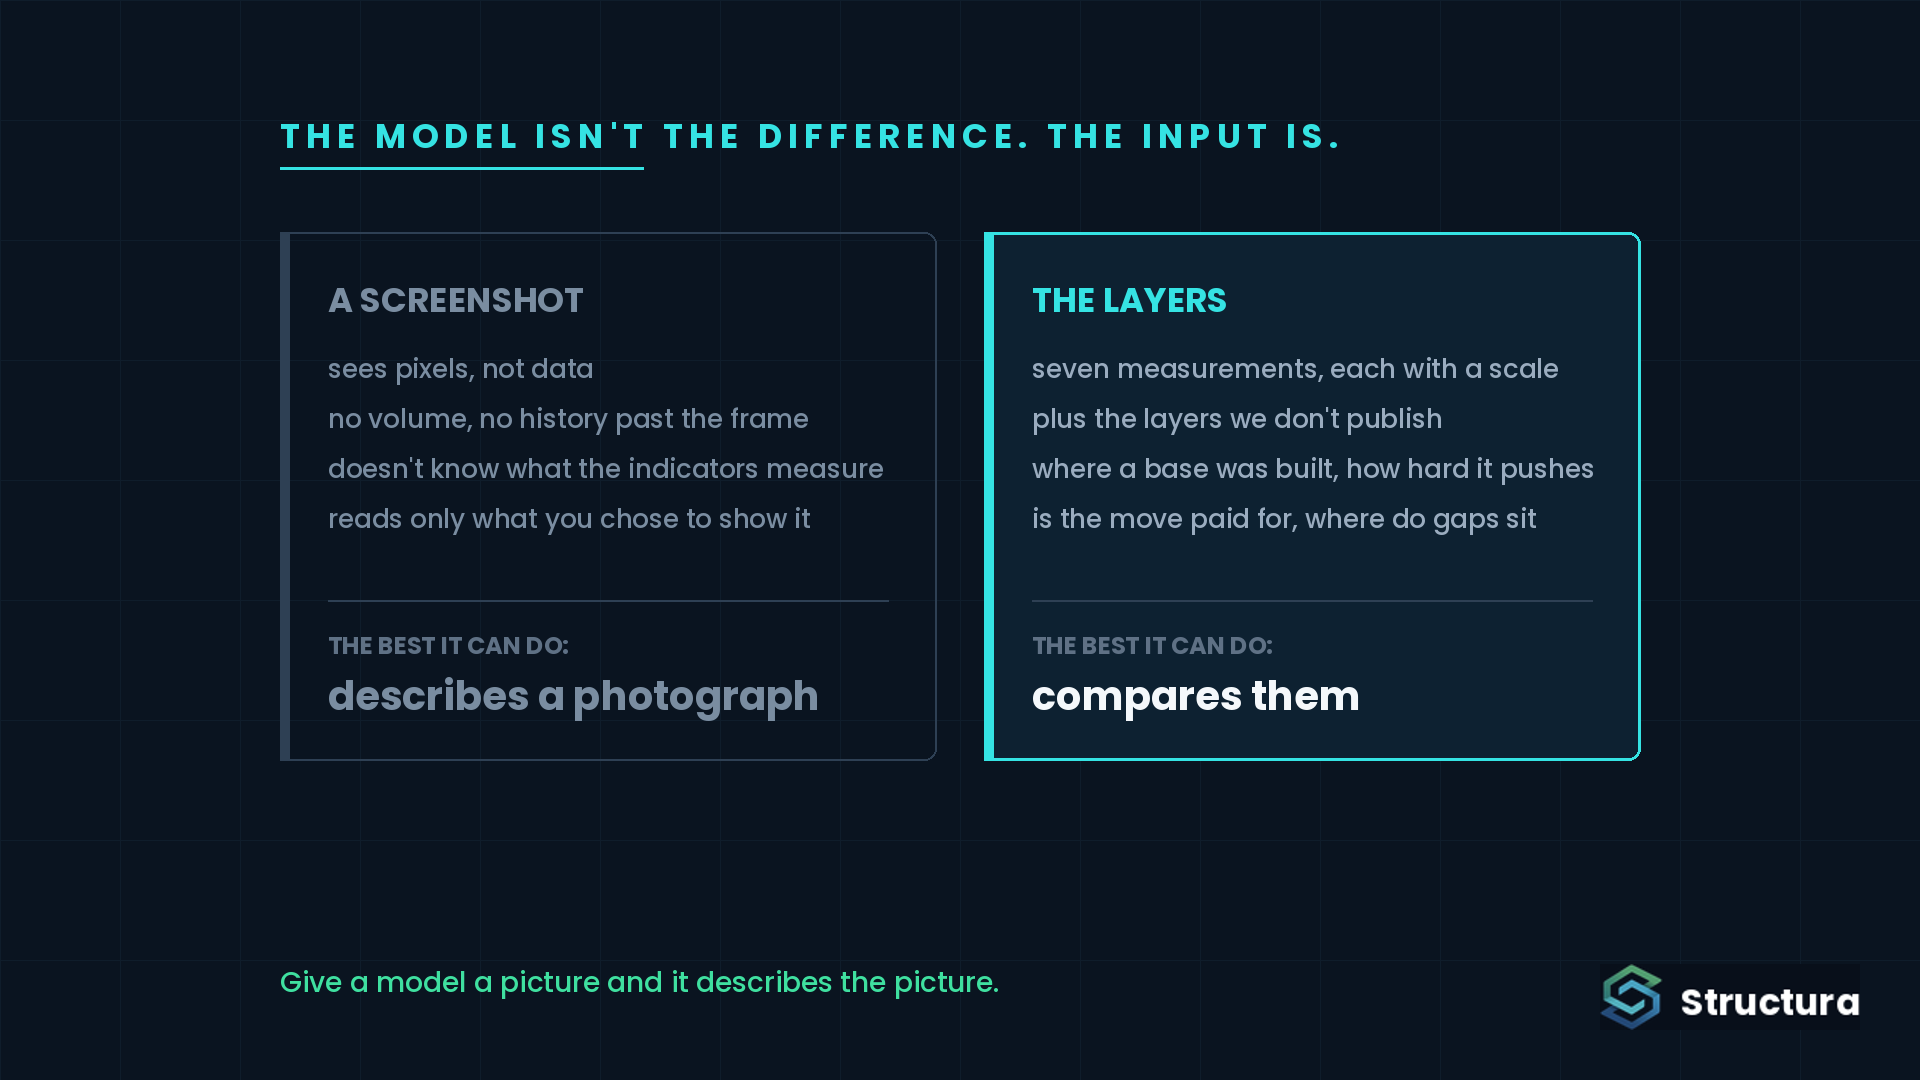
Most "AI chart analysis" works the same way - you upload a screenshot, a language model looks at the pixels and tells you what it sees. It has no volume, no history beyond the frame, no idea what the indicators on screen measure. It is describing a photograph, and it sees only what you chose to show it.
Prism is handed something else: the state of every Structura layer on the chart, each with a defined meaning and a defined scale. Where price built a base. How much force is behind the move. Whether the move is being paid for. Where price left gaps behind. Which levels keep getting tested. Plus the layers we do not publish, which exist so the read has more to check against than you can see on screen.
The model is not the difference. The input is. Give a model a picture and it describes the picture. Give it seven independent measurements and it can compare them.
First read: gold and the dollar
Both on the daily, one question.
Readiness. Gold 34%, dollar 50%. Readiness is how much of the system agrees and how strongly. It is not a probability and it is not a forecast. Forty means split; eighty means pulling the same way.
Gold. The structural layer silent - no accumulation signal in 777 bars, on low volume. Horizon slightly below zero. The scanner's momentum at -44, money flow at -12. Far more unfilled gaps above price than below. A compression layer firing with momentum recovering. And the unpublished layers pulling the other way from the visible ones. In Prism's words: "The system is divided."
The dollar. Momentum strong on every clock it checks, Horizon well above zero, the unpublished layers confirming. Readiness 50% - and it says why: "not because of layer conflict - the direction is clear." Split for a different reason.
Across the pair. Zero percent alignment. "No multi-instrument confluence." Gold and the dollar are not moving in sync, and it says so instead of averaging them into something.
What would change the read. For gold: Horizon back above zero, money flow turning positive, a close holding above the nearest tested support. For the dollar: Trend above zero. Not a target - a protocol. What you would need to see to believe the read more, and what would tell you it was wrong.
Second read: Nike, before the print
Thursday, daily and weekly together, hours before earnings.
This time the layers agreed. 78% confluence: compression, gaps, momentum and divergence all leaning the same way on both clocks, the unpublished layers confirming, the structural zone open on both.
And still Readiness in the mid-forties. "Layers are aligned, but they lack velocity." Agreement without force is not conviction, and it would not pretend otherwise.
Then it flagged its own data. The liquidity layer put the nearest resistance at 37 on the daily and 47 on the weekly, and Prism called it out - "a structural disagreement on the upside reference" - instead of quietly picking one. A tool that tells you where its inputs disagree is a tool you can calibrate against.
The slowest clock, which Prism was not asked about, is the one we talked through on TrendSpider's stream that night: one structural line under Nike's monthly since the 1980s, never closed below, now about twenty percent away. Prism reads what you ask it. The monthly is a reminder to ask the right clock.
What it refuses to say
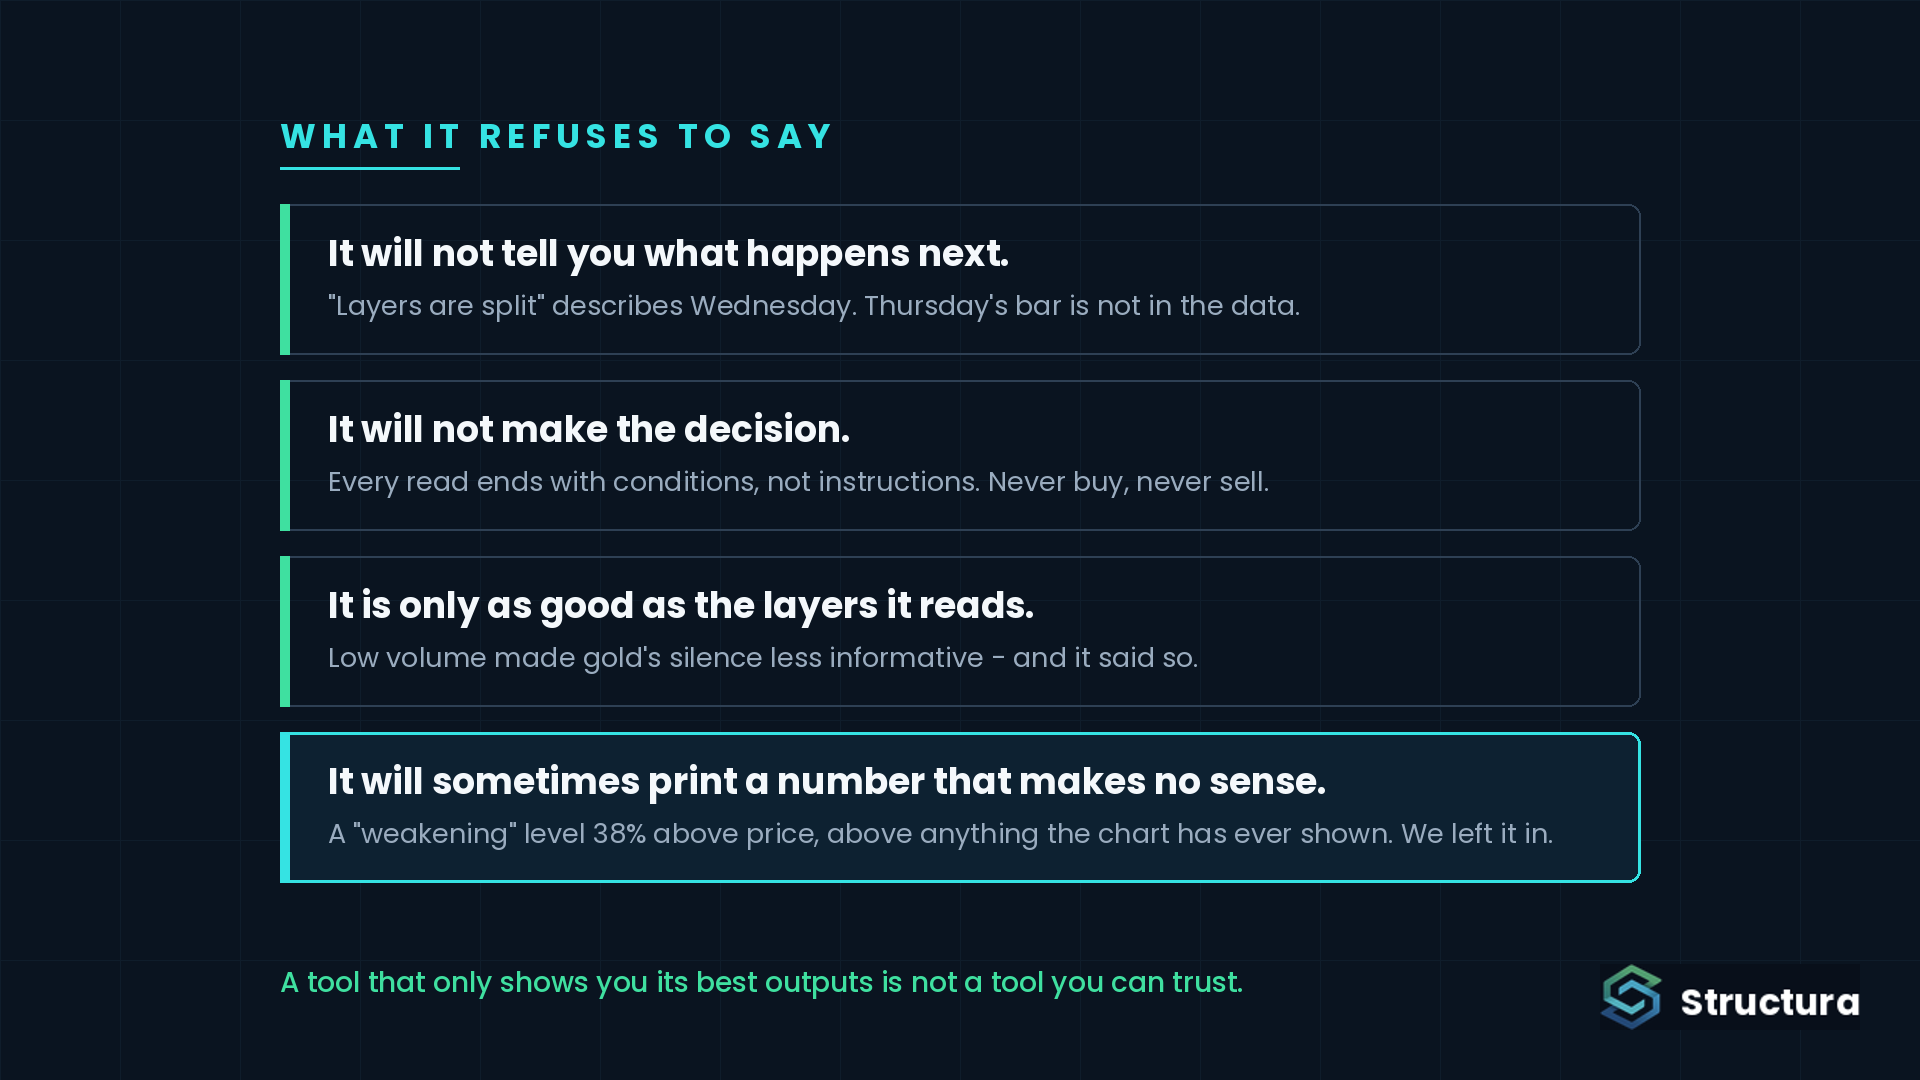
It will not tell you what happens next. "Layers are split" describes Wednesday. Thursday's bar is not in the data. If an AI tool gives you a direction with a percentage attached, ask where the percentage came from.
It will not make the decision. Every read ends with conditions, not instructions. Whether a divided system means wait, size down or do nothing is yours. Never buy, never sell - not a disclaimer, the design.
It is only as good as the layers it reads. Low volume made gold's structural silence less informative, and it said so. It cannot read what the layers do not measure.
It will sometimes produce a number that makes no sense. Among the conditions that would weaken the gold read, Prism listed a close above 5,768 - 38% above where gold was trading, above anything the chart has ever printed. Technically consistent with its own logic; practically useless. We are showing it because a tool that only shows you its best outputs is not a tool you can trust, and because you should be able to catch it when it happens.
Last week's receipt
We left gold and silver on Horizon's zero line from opposite directions and asked which leaves first.
Both did - downward, within a few hundredths of each other. The scanner's momentum sits at -38 on gold and -44 on silver; neither structural layer has spoken, 778 and 700 bars of silence.
So we asked Prism to read them together. Gold: Readiness 35%, split. Silver: 43%, split. Across the pair: 0% alignment. In its words, "treating them as a single precious-metals complex would be premature."
Two metals that just did the same thing in the same week, and the layers underneath say they share nothing. What they have in common is a direction. What they do not have in common is a structure. A price chart cannot make that distinction; a screenshot never will.
And one more honest note: Prism did it again. The silver "invalidation" level it listed is roughly double where silver trades - the same flaw as on gold, on a second instrument. We flagged it to the team. We are telling you because that is what a receipt is for.
Where Prism lives
Prism reads every Structura layer on your chart - and the ones we do not publish - and writes the read. Which layers agree, which disagree, what is blocking a cleaner picture, what would have to change. Two symbols at once, if you want to know whether they agree with each other.
It lives in Vector and Vantage - 100 reads a month, or 150. Accumulate, Divergence and Blocks stay free, for everyone.
One question. One read. Never buy, never sell.
We map process, not predictions.
Read us first in your Google results:
Free on TradingView
Get the free structure layer.
Structura Accumulate marks where the market may be rebuilding structure before the move becomes obvious.