

Reading market structure in layers - and why the contradictions carry the information
First published in German in VTAD-News No. 45 (September 2026). Charts: TradingView, as of 1 September 2026.
The confirmation problem
Most of us were trained to look for agreement. We add an oscillator, then a second one, and when both point the same way we feel more confident about what we are seeing. The confidence is real. The information usually is not.
Three momentum oscillators calculated from the same price series will agree most of the time, because they are three descriptions of one measurement. What feels like confirmation is often just repetition - the same question asked three times in slightly different words. The analyst ends up with more screen real estate and no more knowledge.
The alternative is not fewer tools. It is tools that answer different questions - and then paying attention specifically to the moments when their answers do not line up.
Three questions, three layers
We organise our reading around three questions that are genuinely independent of one another.
Where is price being accepted? This is the structural question. Not where price travelled, but where it was repeatedly transacted and held - the zones that were built rather than visited. Structure changes slowly and describes the terrain.
How is momentum behaving underneath? Not merely its direction, but its quality: is a move building on compression, or stretching into exhaustion? Momentum turns before structure does, which makes it the earliest of the three - and the least reliable in isolation.
Is the move being paid for? Participation. A price advance without corresponding volume-weighted commitment is a move that has not been financed. This layer follows price rather than leading it, which is precisely why its divergence from momentum is more informative than its absolute level.
When all three answers agree, the situation is usually already understood by the market and generally uninteresting. Agreement is where positions have been established, not where they are being decided.
Disagreement is where the analysis begins.
A state describes a phase, not a verdict
This distinction is the heart of the method, and it is the one most often lost in practice.
In our framework a structural state - distribution, recovery, contraction - is deliberately sticky. It holds from the moment it triggers until the opposite condition fires. It does not update because yesterday's candle was green. It describes the phase the market is in, not the direction the next bar will take.
The practical consequence surprises people: an instrument can be labelled as being in a distribution phase while price grinds higher for weeks. That is not a stale reading. Distribution describes what is happening to supply and demand across a period; a week of higher closes inside that period contradicts nothing. Think of it as a season rather than the weather. One warm afternoon does not end the autumn.
Once states are read as phases, the table stops arguing with the price action and starts explaining it. And it produces a second, more useful category of observation: rows where the label and the numbers disagree. A distribution phase with rising momentum is a market refusing to break. A recovery label with momentum still at its floor is a phase that has opened without being paid for yet. Neither is a signal. Both are conditions worth understanding before anything else is done.
An example: gold, 1 September 2026
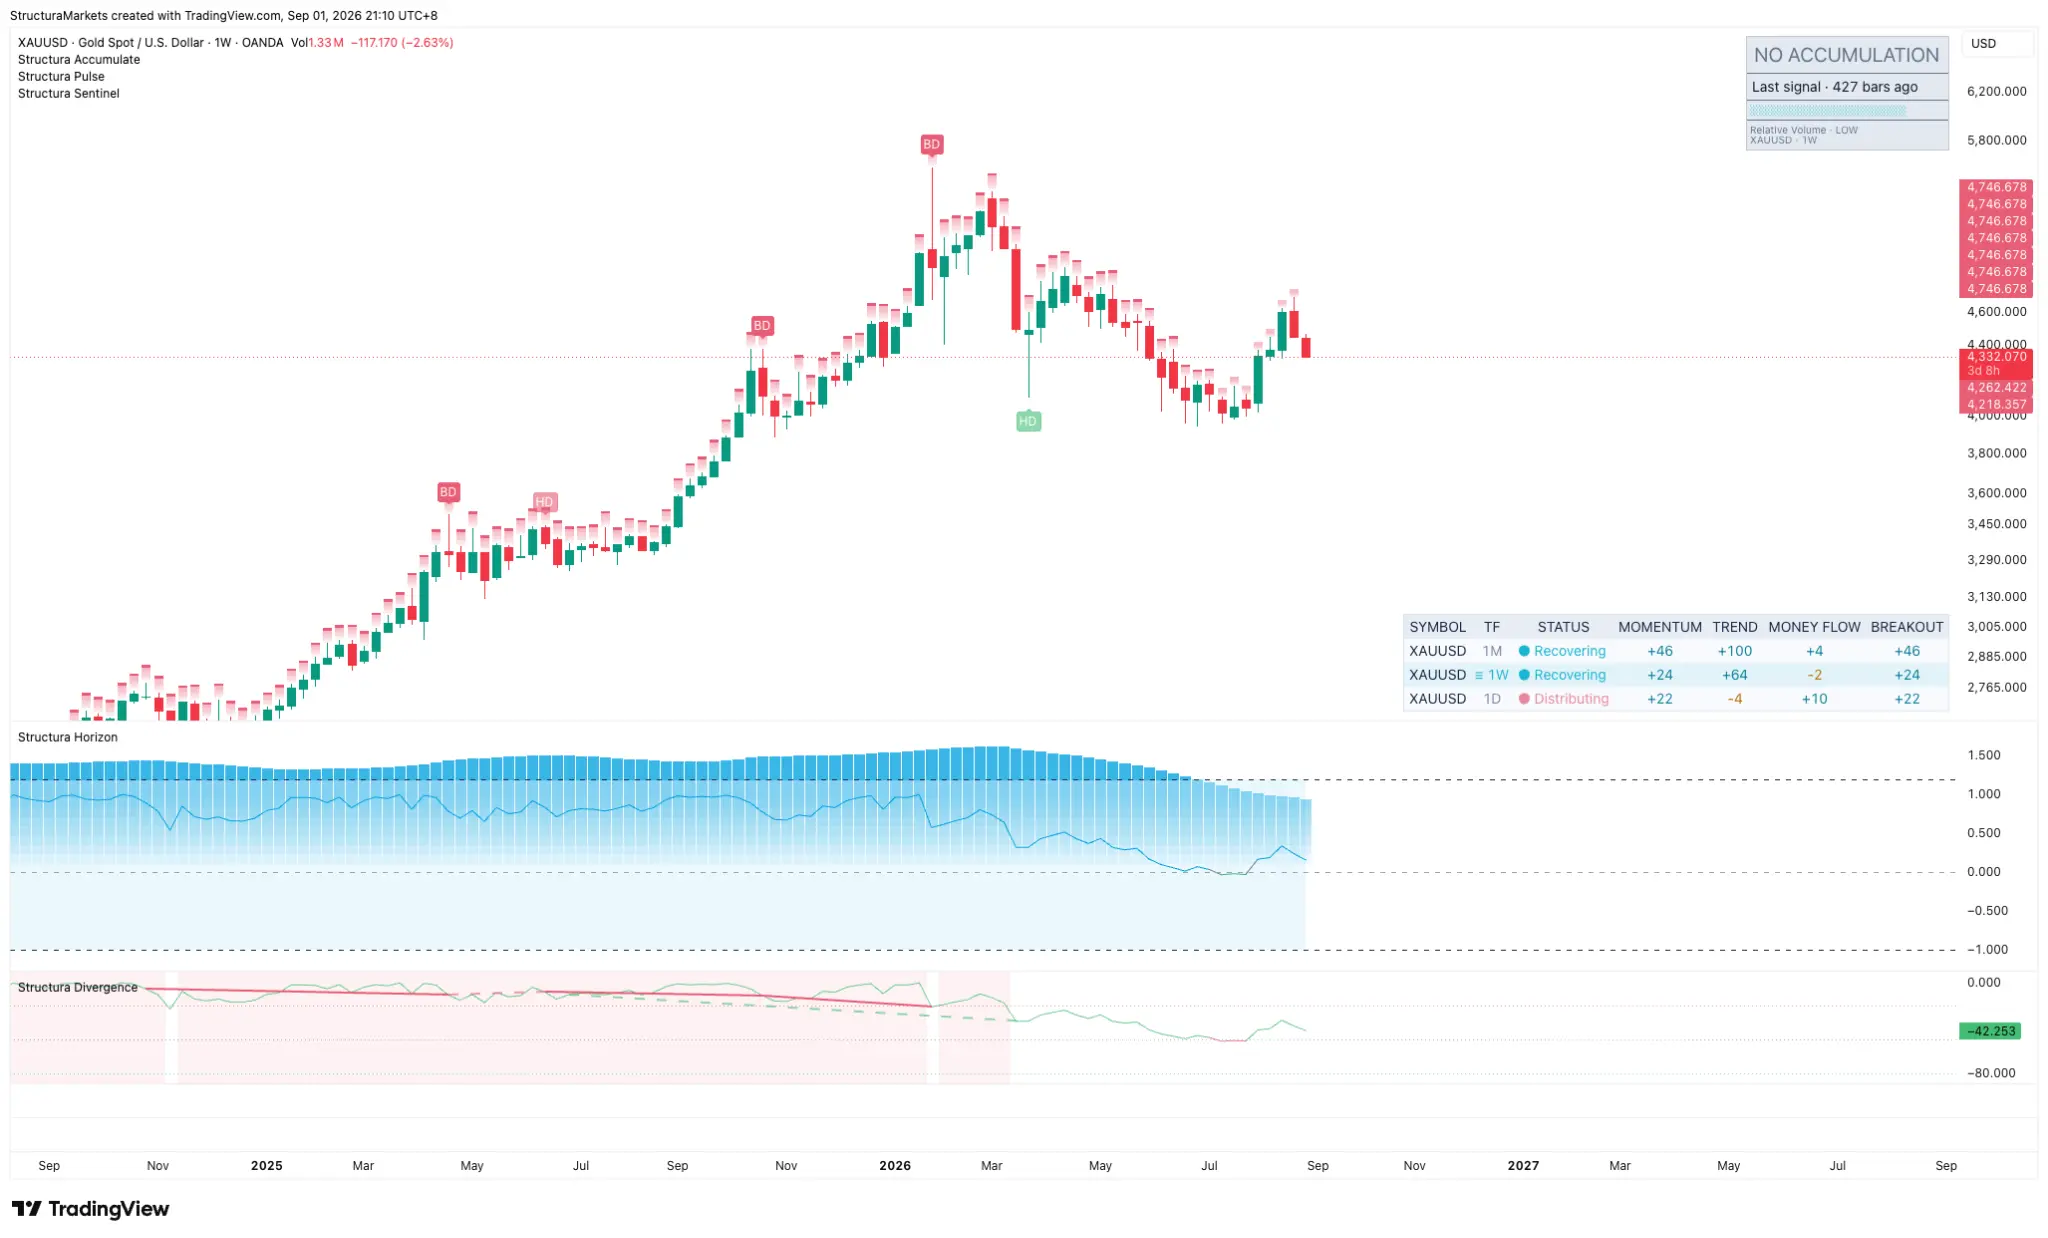
The board below is gold as this article was written, on 1 September 2026. Four timeframes, four different sentences about the same metal.
The monthly and the weekly clocks both read recovering - the weekly with momentum at +24 and money flow at -2. The daily, immediately beneath them, reads distributing: momentum +22, money flow +10. The four-hour clock reads distributing as well, but its momentum has collapsed to -76. And the fastest clock on the board, the one-hour, has already flipped to recovering while its momentum sits at -98, at the floor of the scale.
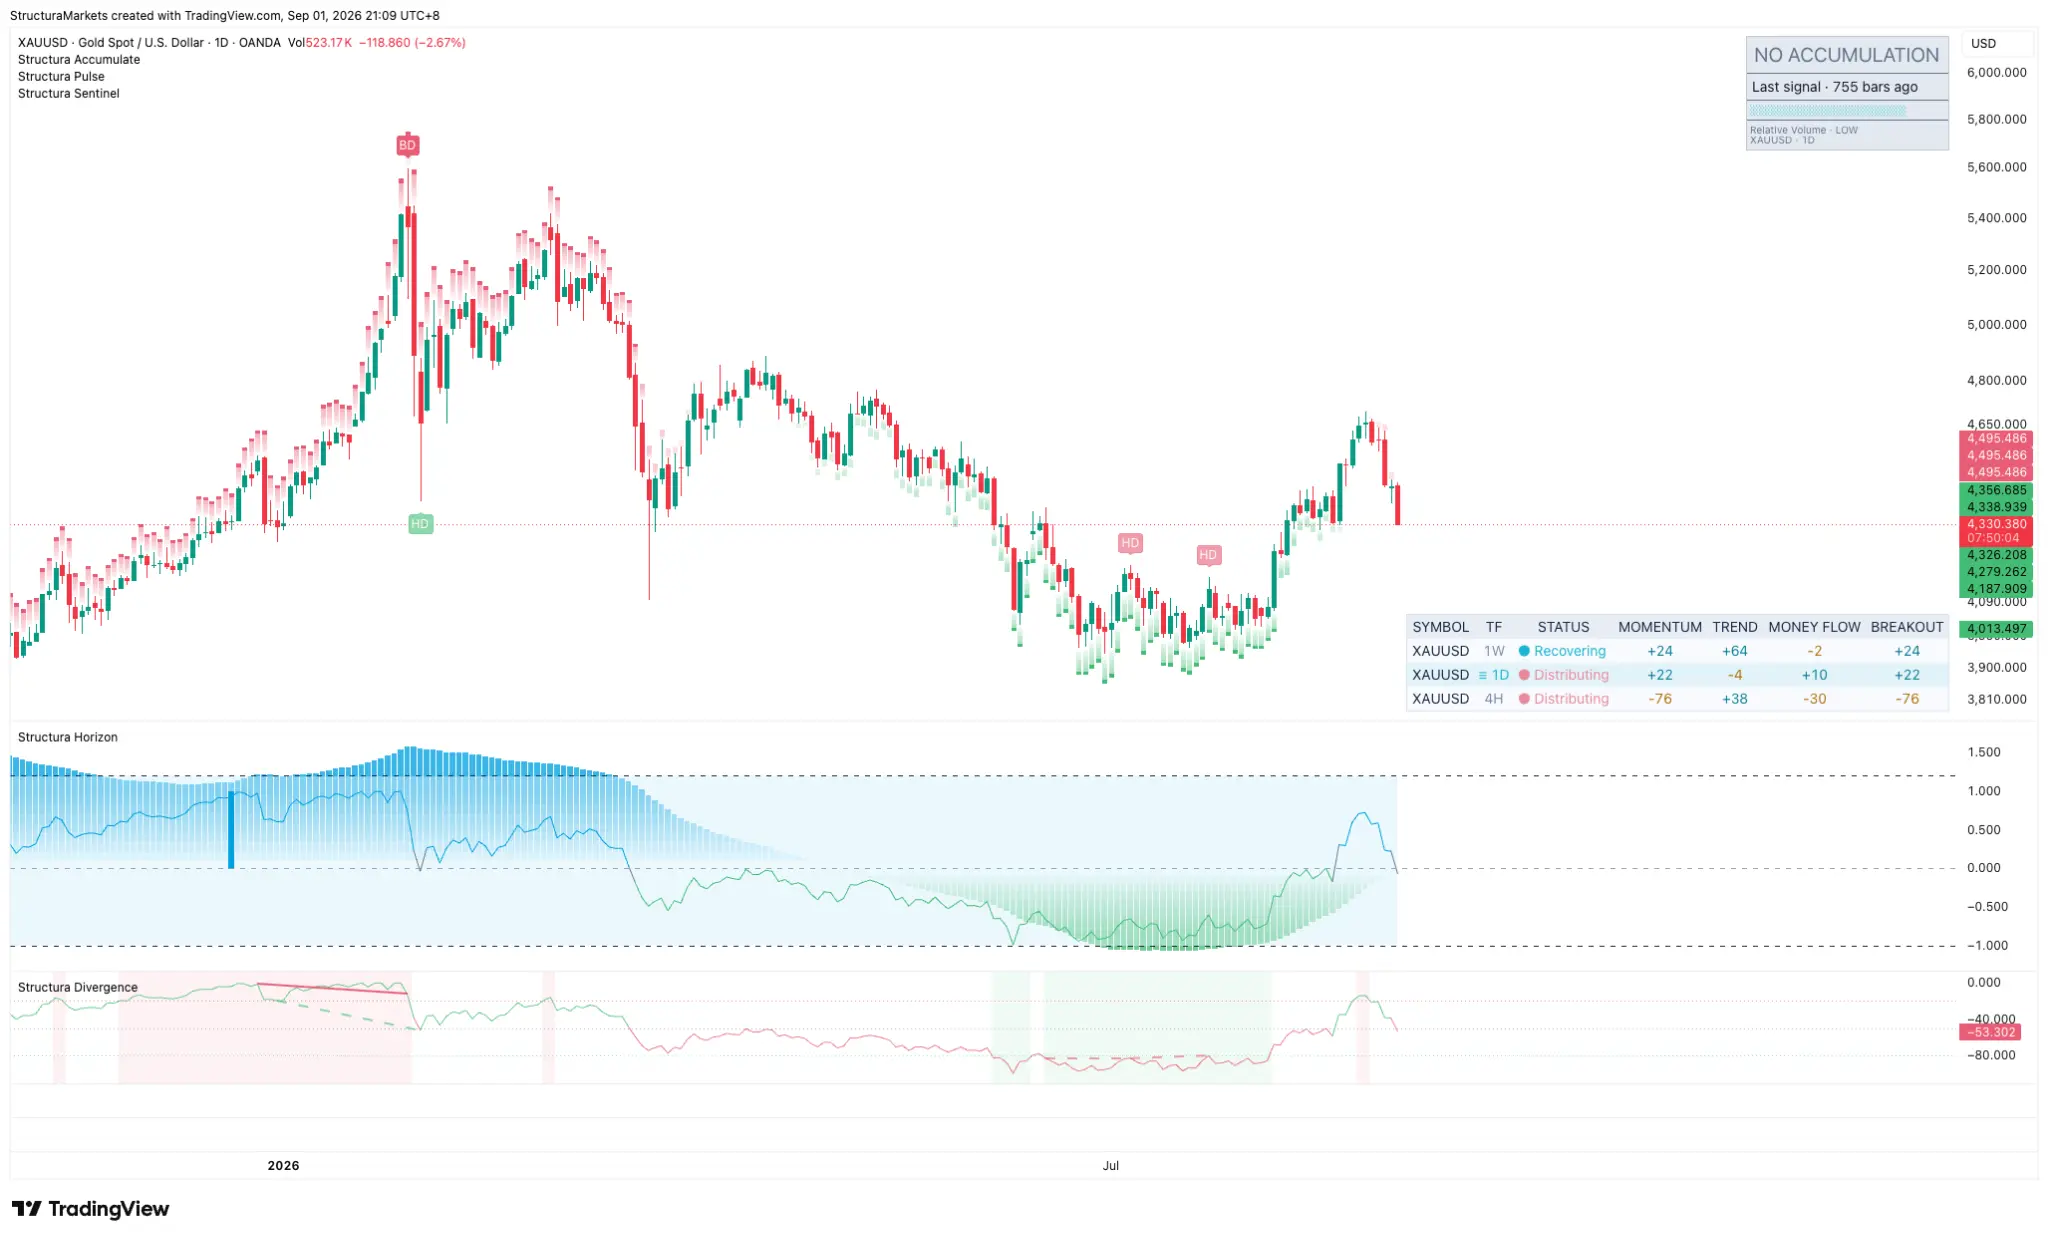
Read as forecasts, those rows are incoherent. Read as phases, they are one event observed at four speeds. The fastest clock turns first, the slowest turns last, and the ones in the middle referee. What the table is describing is a transition in progress - and a transition looks exactly like a contradiction while it is happening.
The one-hour row is the clearest instance of the second category described above: a label and its numbers disagreeing. Recovering with momentum at -98 is not a market that has recovered. It is a market that has met the condition which opens that phase while every underlying reading is still at its extreme. That is not a signal to do anything. It is a condition to hold in mind while the higher timeframes are read.
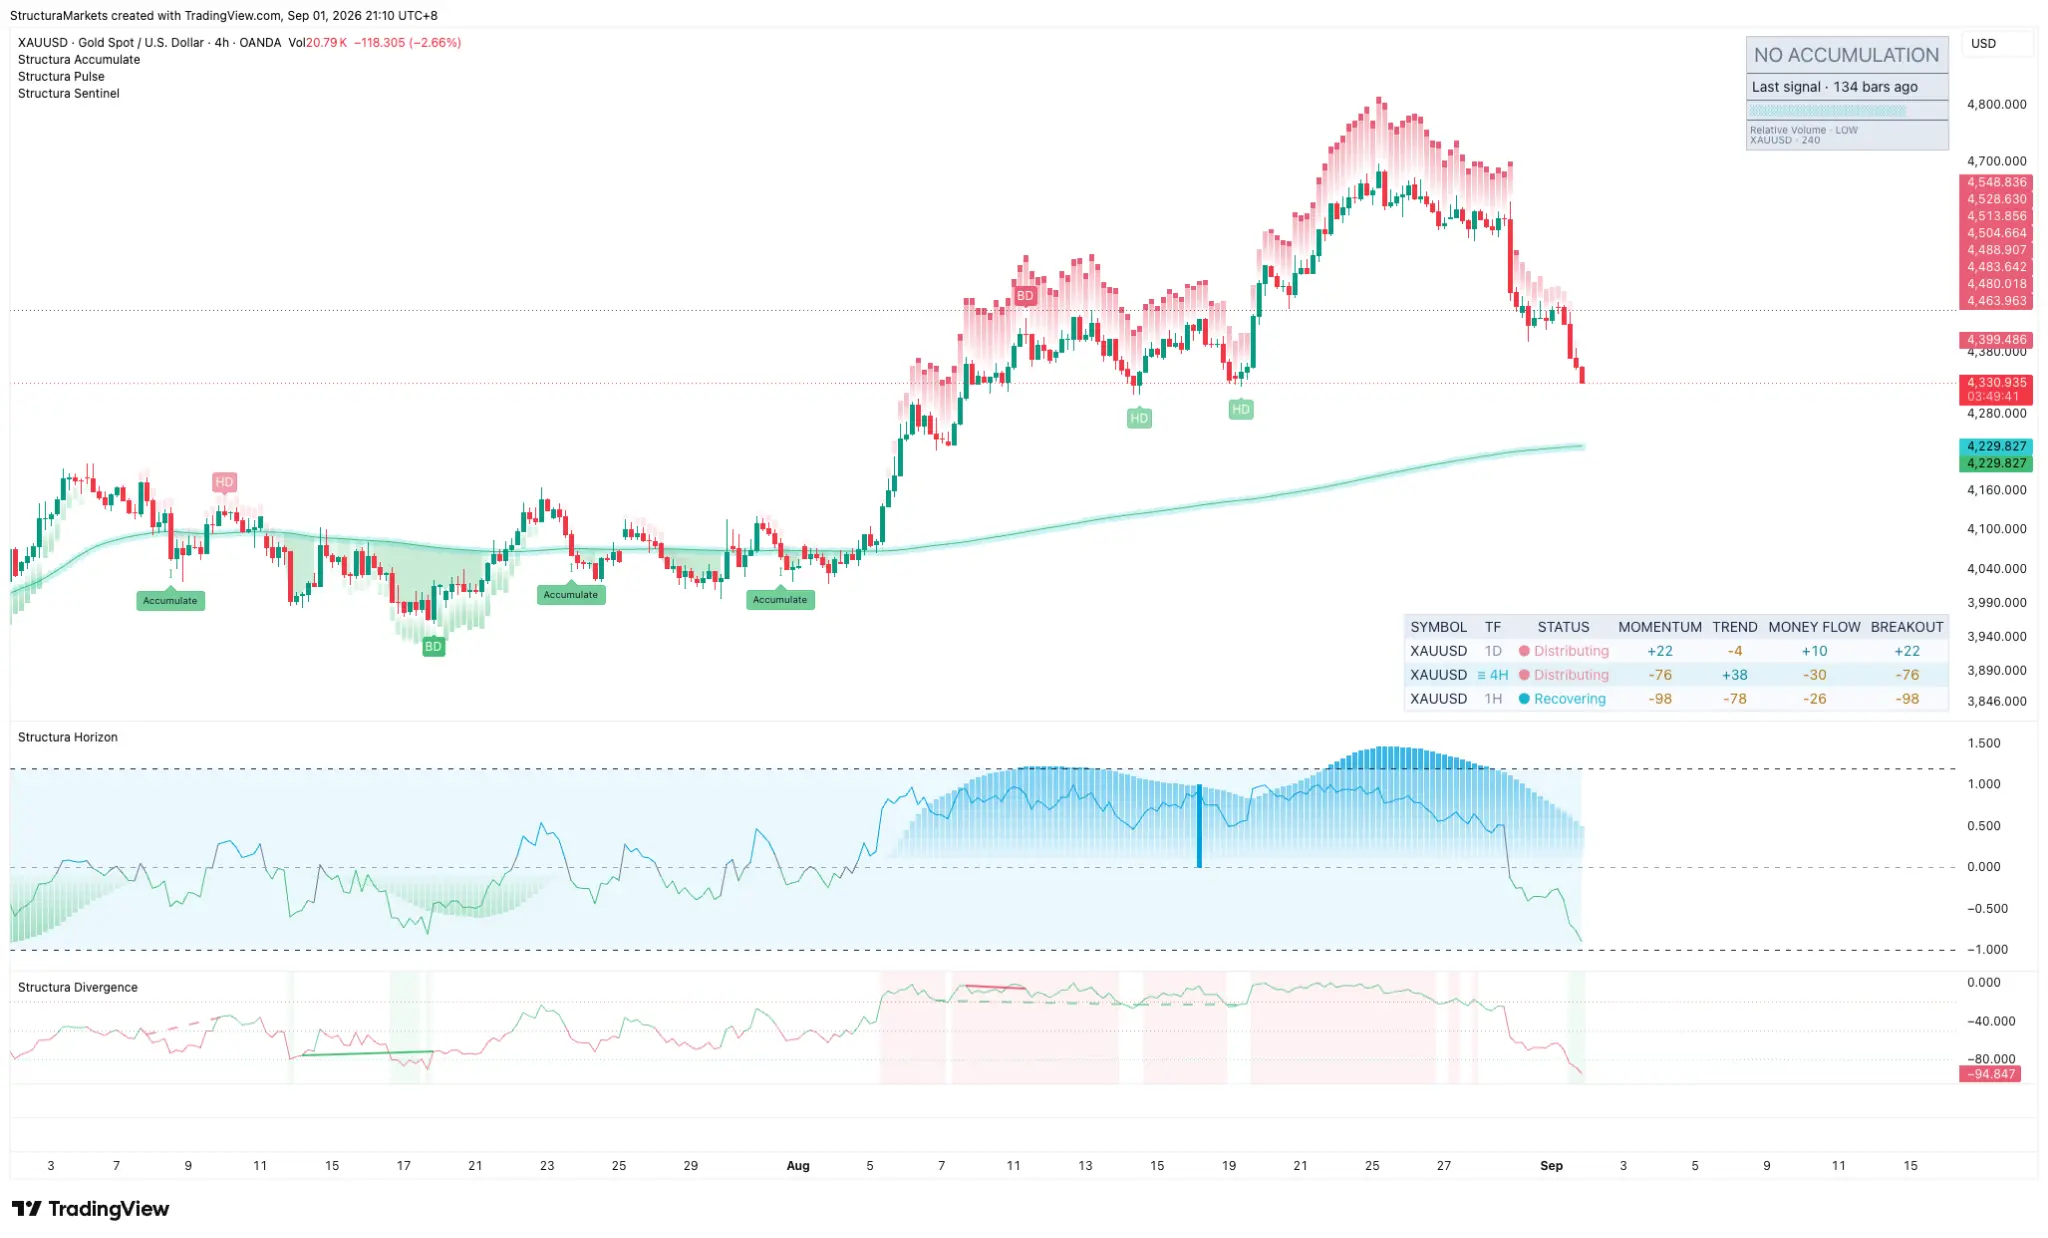
The momentum-participation gap is the second observation. On this board the widest sits on the four-hour: momentum at -76 against money flow at -30, a spread of roughly 46 points. On the weekly the same pair reads +24 against -2. Participation follows price rather than anticipating it, and it has not travelled as far as momentum has. Neither number predicts anything on its own. The gap between them is the observation.
Then the structural layer. On the four-hour chart an accumulation zone opened in early July, in the 4,000 to 4,100 area, and price spent weeks inside it before accepting above the reference and leaving it. The panel now reads no accumulation, which is the exit from that zone rather than an absence of one. On the daily and the weekly the layer has been quiet far longer - 755 and 427 bars respectively since it last spoke - and relative volume is low. The advance that followed, from the July zone up to the high near 4,800 in late August and back to roughly 4,330 in the days since, ran without any fresh structural endorsement on the higher timeframes.
That silence forecast nothing. Zones fail, and a zone that held once carries no promise about the next one. It simply meant the structural layer had nothing to say about this particular move, and we did not talk over it.
This article was written on 1 September and printed three weeks later. That delay is deliberate. A description of the present should be checkable against what followed it, and readers are invited to do exactly that.
Silence as information
That last point deserves its own section, because it runs against the commercial logic of most analytical tools.
A tool that produces output constantly is a tool that has been designed to feel useful. Genuine structural conditions are rare. Our structural layer speaks a handful of times in a decade on a given instrument, and then says nothing for months. Users new to it often assume a malfunction. It is the opposite: the willingness to stay quiet is what makes the occasional statement worth reading.
An analyst who accepts silence as a category of information gains something practical - the absence of a structural signal becomes a fact about the market rather than a gap in the analysis.
Acceptance and rejection are both results
The framework produces no targets and no entries. What it produces is a well-formed question and two acceptable answers.
Does price spend time above the reclaimed reference, transacting there, building - or does it merely visit and hand the level back? Does the pressing continue until the opposite condition retires the label, or does the phase reassert itself and the advance turn heavy?
Acceptance and rejection are both outcomes. Both inform the next reading. The only losing position is needing one of them to happen - and that need, rather than any failure of method, is what most often turns analysis into forecasting.
None of this makes markets more predictable. It makes the present more legible, which is a smaller claim and a more defensible one.
Read us first in your Google results:
Free on TradingView
Get the free structure layer.
Structura Accumulate marks where the market may be rebuilding structure before the move becomes obvious.
Get the free structure layer