
What an Accumulation Zone Actually Is - and How to Read One Honestly
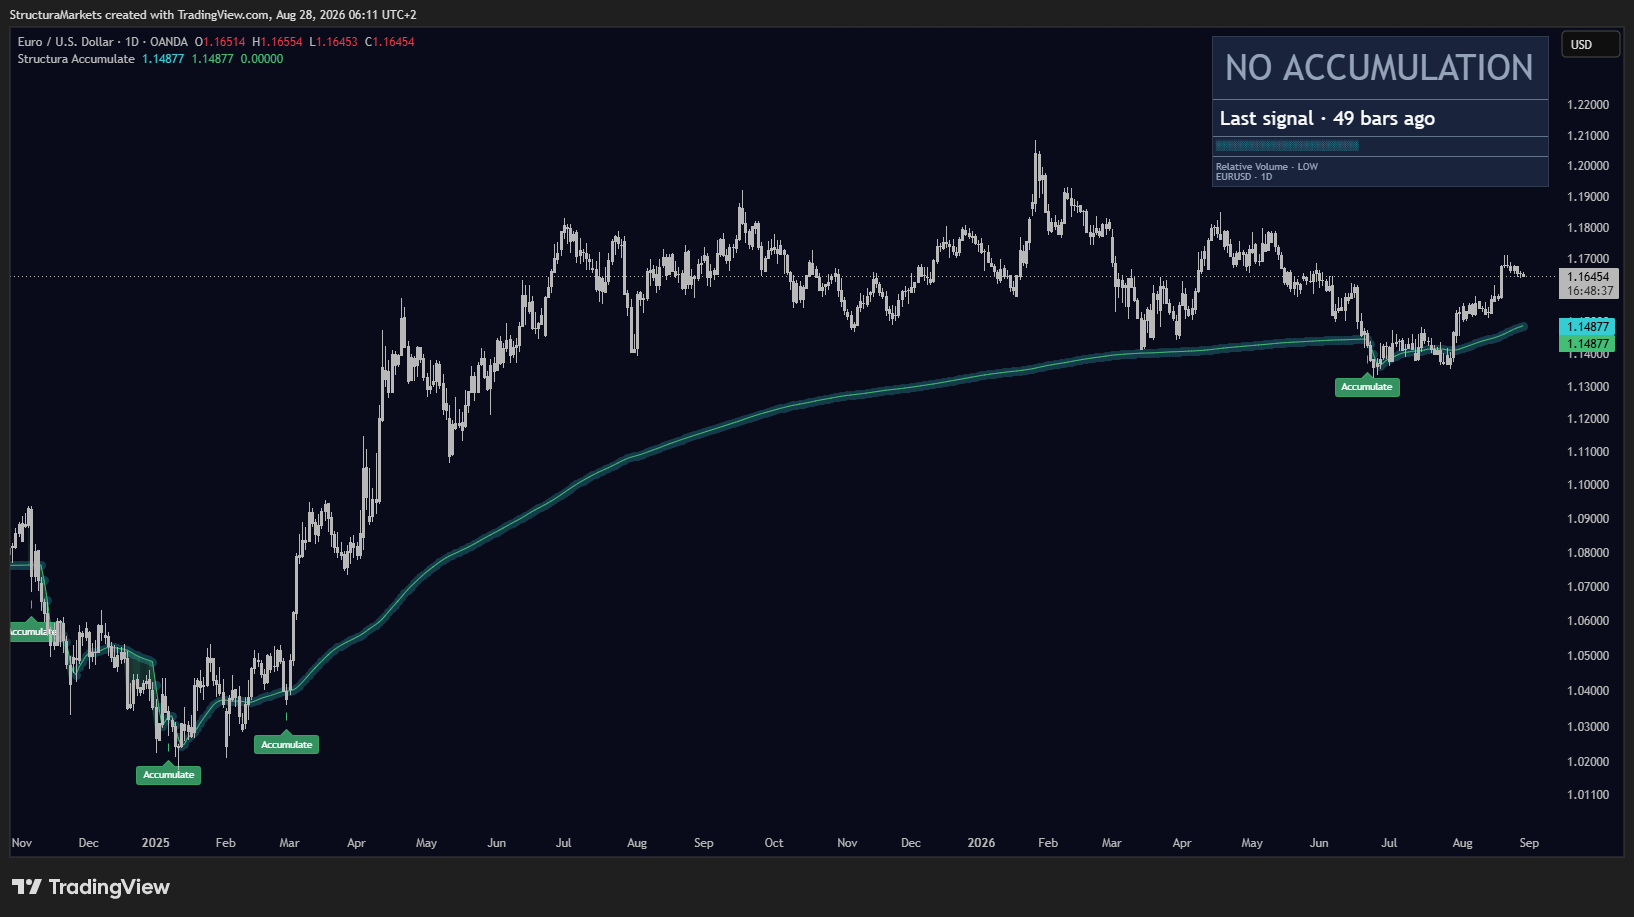
An accumulation zone is a place, not a promise. It marks where price spent time being absorbed - where selling met patient buying and the market stopped going down without yet going up. That is all it marks. Most of what is written about accumulation zones treats them as buy signals with a delay attached. This article is about reading them the other way: as locations worth watching, with a protocol for what would count as evidence - in either direction.
What is an accumulation zone?
In plain terms: a region on the chart where price built a base under quiet conditions. After a decline, price stops making progress downward. Candles overlap. Ranges compress. Volume often thins out rather than spiking - absorption is usually quieter than capitulation. When that behaviour persists long enough to form structure, the region it occupied is an accumulation zone: a shelf of prices where a meaningful amount of the asset changed hands without the market breaking lower.
Momentum has its own way of disagreeing with price - that is what a divergence is.
The name describes the composition of that region - time, overlap, absorbed supply. It does not describe the future. A zone tells you where the interesting question is being asked; it does not answer it.
What an accumulation zone is not
It is not a prediction that price will go up. Zones fail. Bases break. A region that looked like accumulation resolves lower, and the only honest thing a zone ever guaranteed was a well-defined place to find out you were wrong. Any framework that presents accumulation zones as high-probability reversal calls is quietly leaning on survivorship: the zones that worked make the textbook, the ones that failed get cropped out of the chart.
It is not a timing device. Zones are built on the slowest information a chart has - structure. Structure develops over weeks and months, and a zone can sit untouched long after it forms. Treating a structural feature as an entry trigger imports a speed the information does not have.
How accumulation zones form
Three ingredients, all observable:
Time. A zone is earned by duration. Two bars at a level is an arrival, not a base. The longer price is accepted in a region without breaking it, the more meaningful the region becomes - because more supply has been processed there.
Overlap. Bases are made of disagreement resolving slowly: candles that trade through each other's ranges, failed pushes in both directions that go nowhere. Clean trending candles are the opposite of accumulation.
Participation that fits the phase. Absorption tends to happen on unremarkable volume. What matters is the change: a base that suddenly attracts expanding participation on pushes away from the zone is telling you the phase may be ending. A base that rallies on thin volume has produced a move, but not yet the evidence.
How to identify an accumulation zone on a chart
Start with the decline, not the base. A zone means little without context: what was absorbed, and from what height. Then look for where downward progress died - not a single low, but the region where lows stopped extending and time started accumulating.
Mark the region, not a line. Zones are areas. Picking one price and calling it "the level" replaces a structural observation with a false precision the chart never offered. If you need a single reference, derive it from the zone - and treat it as the zone's spokesman, not its replacement.
Let it be rare. If your method finds an accumulation zone on every chart every week, it is finding something else. Structure is the slowest layer of market information; on some instruments a genuine zone appears a handful of times in years. Selectivity is not a limitation of the reading - it is the reading.
The honest protocol: acceptance and rejection
A zone is a hypothesis, and hypotheses need a test both ways.
Acceptance looks like this: price leaves the zone upward, comes back toward it, and the zone does its job - the retest holds, price keeps being accepted above the region, and participation firms up rather than thinning. Note the order: the retest is the evidence, not the breakout. A move away from a zone that has never been asked to hold anything has answered nothing yet.
Rejection looks like this: price fails back through the zone's lows, or returns to the region and slices through it as if the absorption never happened. That is not the method breaking. That is the method working - a zone that fails has told you, at a known location and a known time, that the base was not what it appeared to be. Rejection is information. The traders who get hurt by zones are rarely the ones who drew them; they are the ones who refused to accept the second half of the protocol.
Write both conditions down before the test comes. The entire value of a zone is that it lets you define, in advance and in public if you like, what would change your mind. A zone read after the fact is a story; a zone read before the resolution is a record.
Silence is information too
Most of the time, a structural read says nothing - and that is a feature. Between the moment a zone forms and the moment the market tests it, there is usually nothing to do and nothing to say. A tool or a process that fills that silence with commentary is manufacturing signal out of noise. The discipline of zone reading is mostly the discipline of waiting: the chart will ask the question at the zone, on its own schedule, and no amount of narration accelerates it.
Reading zones with a structure layer
This protocol is the reason our own structure layer - Structura Accumulate - behaves the way it does. It marks accumulation zones and derives an adaptive reference from them, it shows how many bars have passed since it last spoke, and it reads relative participation - and then it stays quiet, sometimes for hundreds of bars. It does not forecast, and its marks are dated when they are printed, so every read can be checked after the fact instead of taken on faith. The zones it has marked have held, and some have failed - both are on the charts, because both are the record.
For the five-phase model and a real range, read the full guide to Wyckoff accumulation.
For how Accumulate compares with TradingView's built-in tools, see our list of free TradingView indicators for market structure.
Accumulate is free to use. If you want to read zones on your own charts with the protocol from this article, it is the layer we built for exactly that.
Educational market commentary - not financial advice.
Read us first in your Google results:
Free on TradingView
Get the free structure layer.
Structura Accumulate marks where the market may be rebuilding structure before the move becomes obvious.