
One system for reading market transitions.
Structura combines Accumulate, Horizon, Pulse, and Sentinel into a structured workflow for reading structure, momentum, trend behavior, and market conditions.
Structure → Momentum → Trend → Scan
PRISM · AI MARKET STRUCTURE ASSISTANT
Your chart shows six layers. Prism reads all of them.
Prism is an AI assistant that reads every Structura layer on your chart - and the layers we do not publish - and writes the read. Ask about any market and timeframe, or several at once. It tells you which layers agree, which disagree, which are silent, and how ready the whole system is.
Prism's output is generated by an AI system from Structura's layer data. It is educational analysis, not financial advice, and it can be wrong.

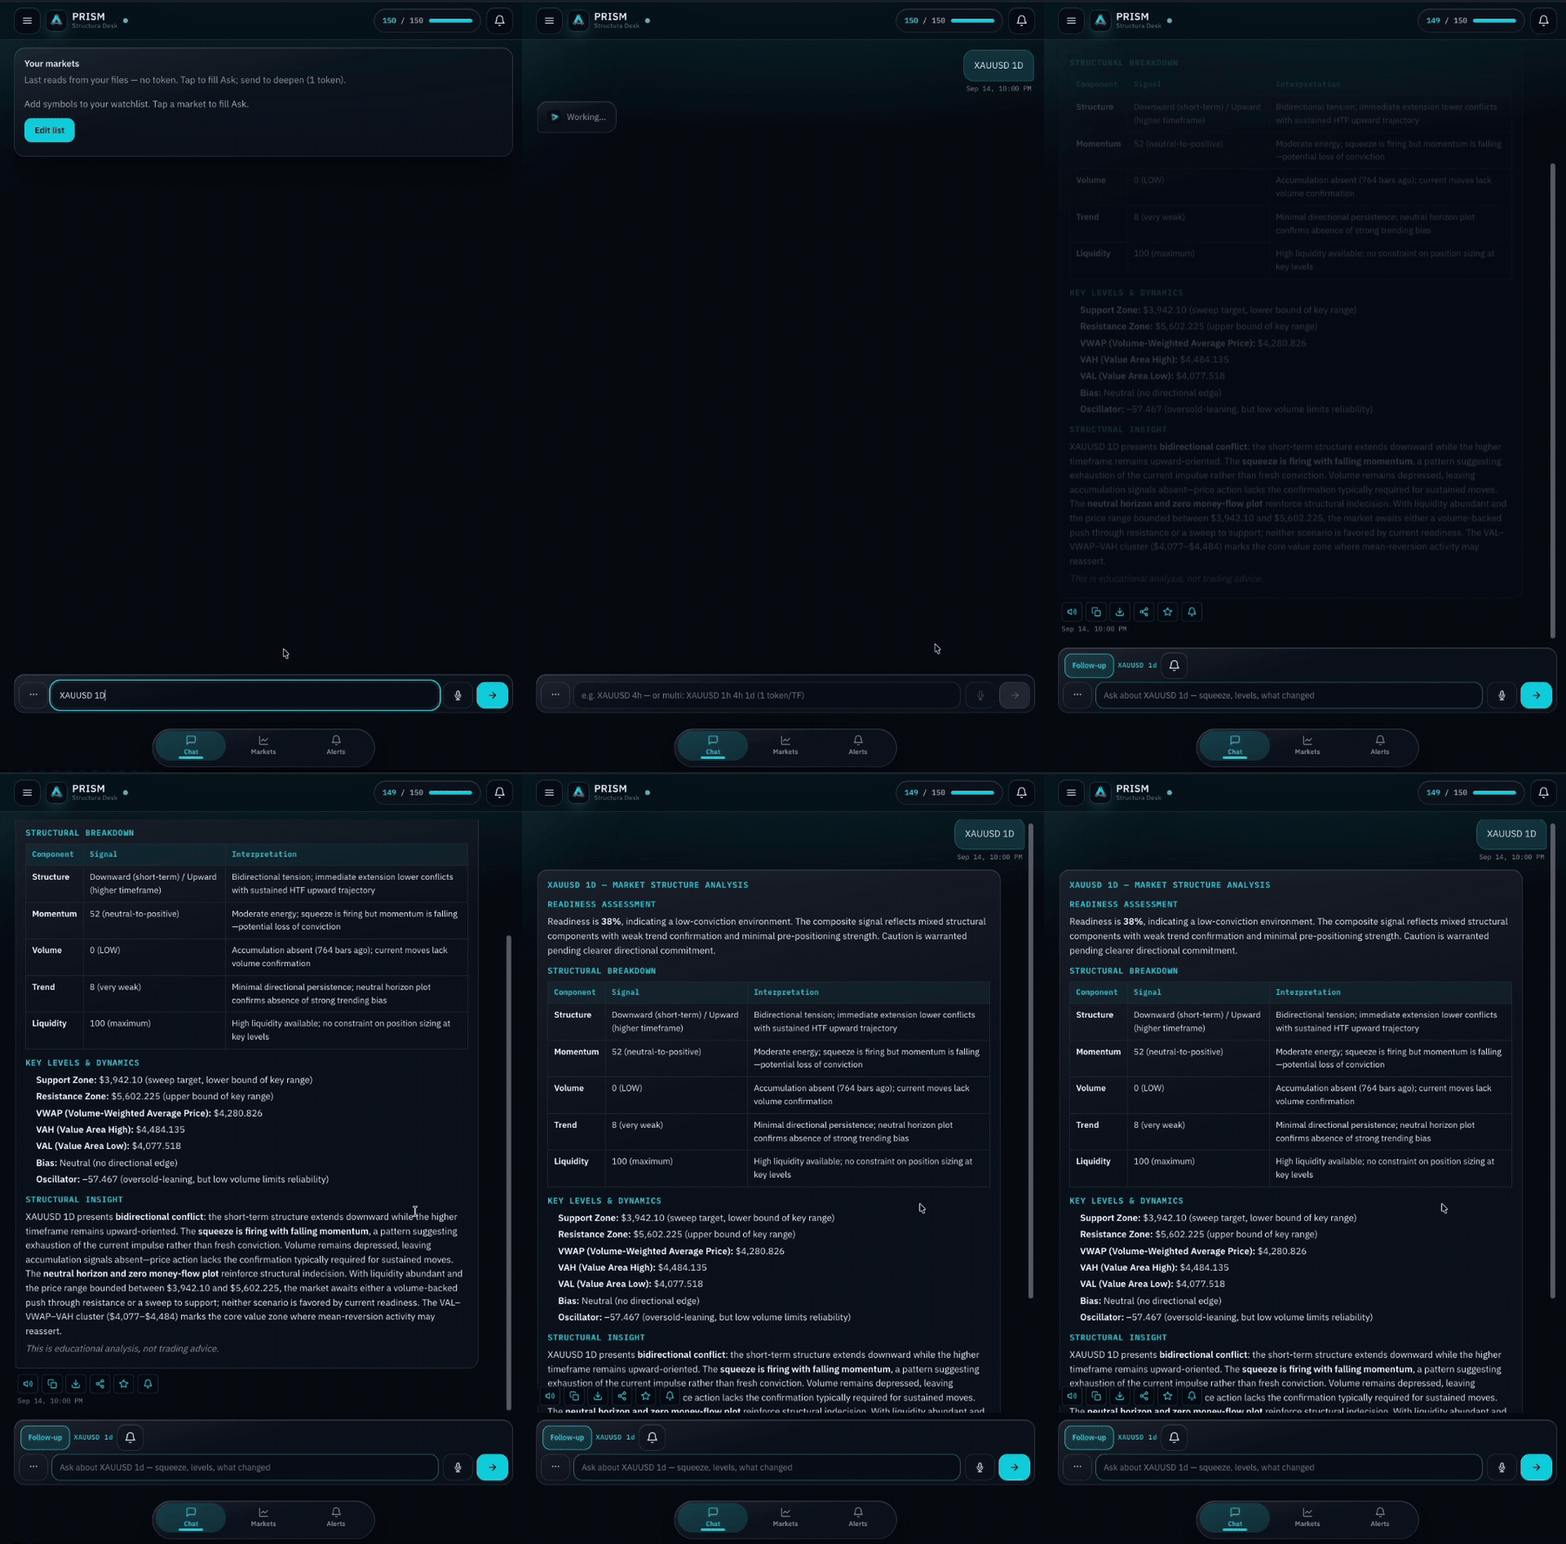
What you ask
any symbol, any timeframe
several timeframes at once
your whole watchlist in one question
"what changed since yesterday"
What you get
the state of every layer, named
where the layers agree and where they conflict
the one thing blocking a cleaner read
what would have to change - as conditions, not forecasts
the read in the voice you know from Sundays
What it will not do
no buy, no sell
no targets, no stops
no narrative when the layers are quiet - it says they are quiet
Readiness is how much of the system agrees, and how strongly. It is not a probability and it is not a forecast.
Prism is included in Vector and Vantage.
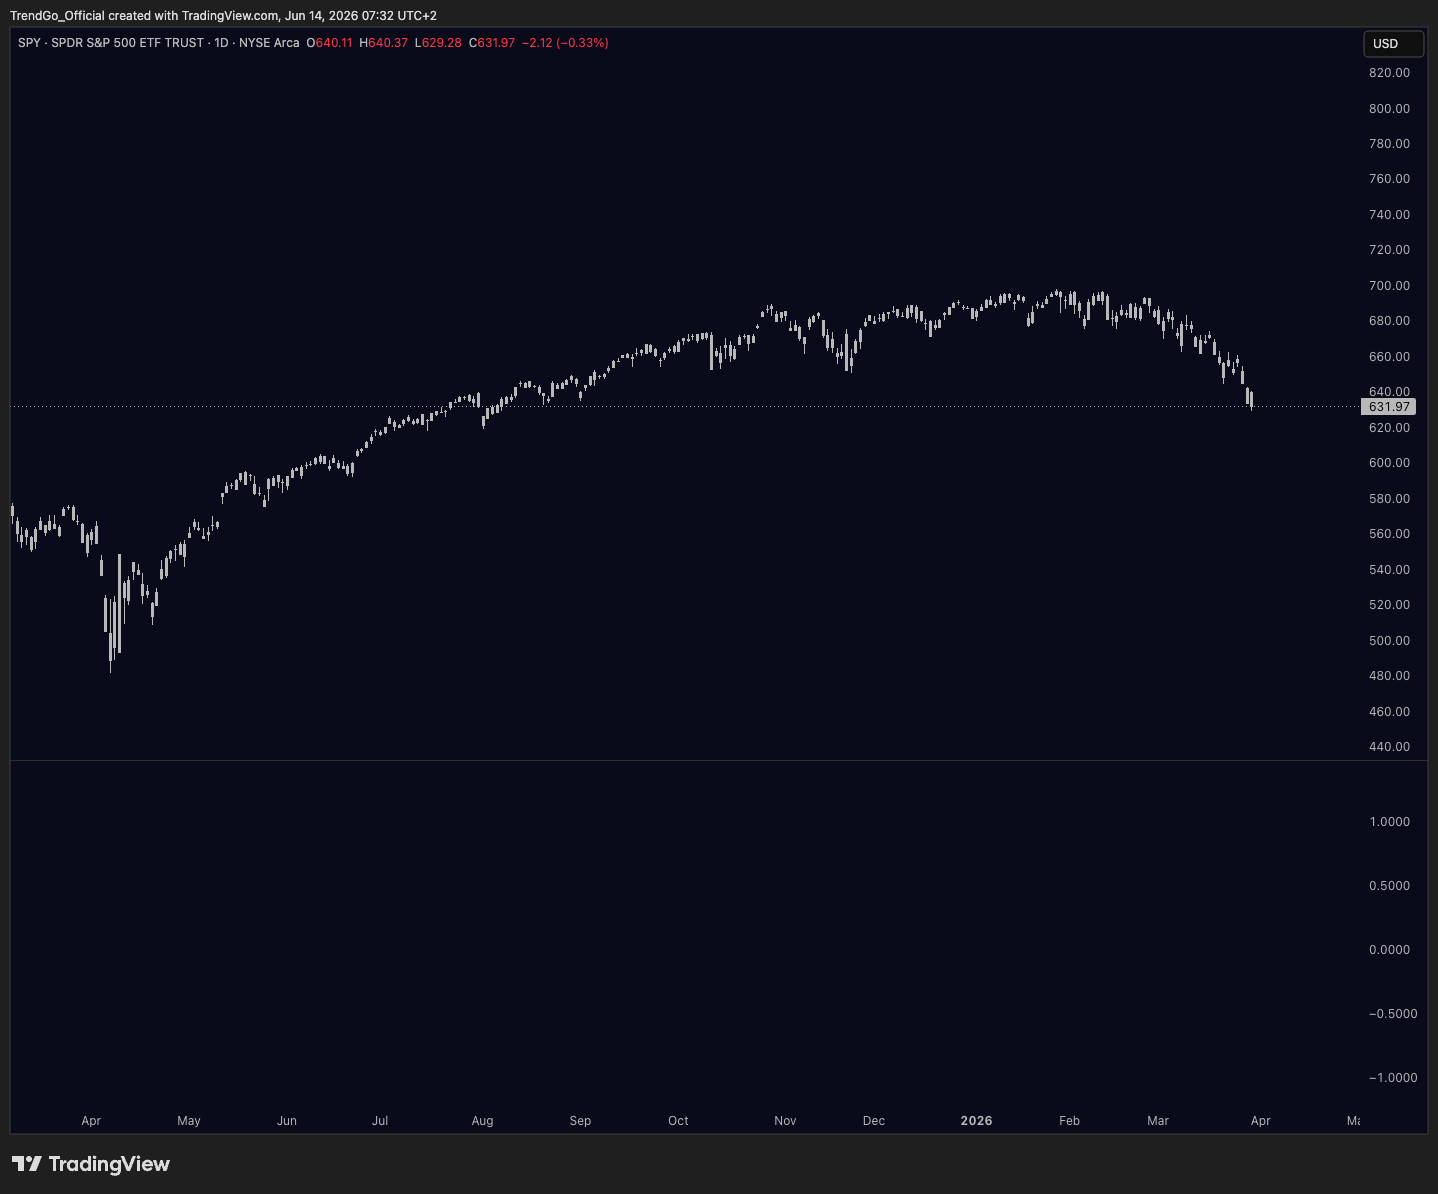
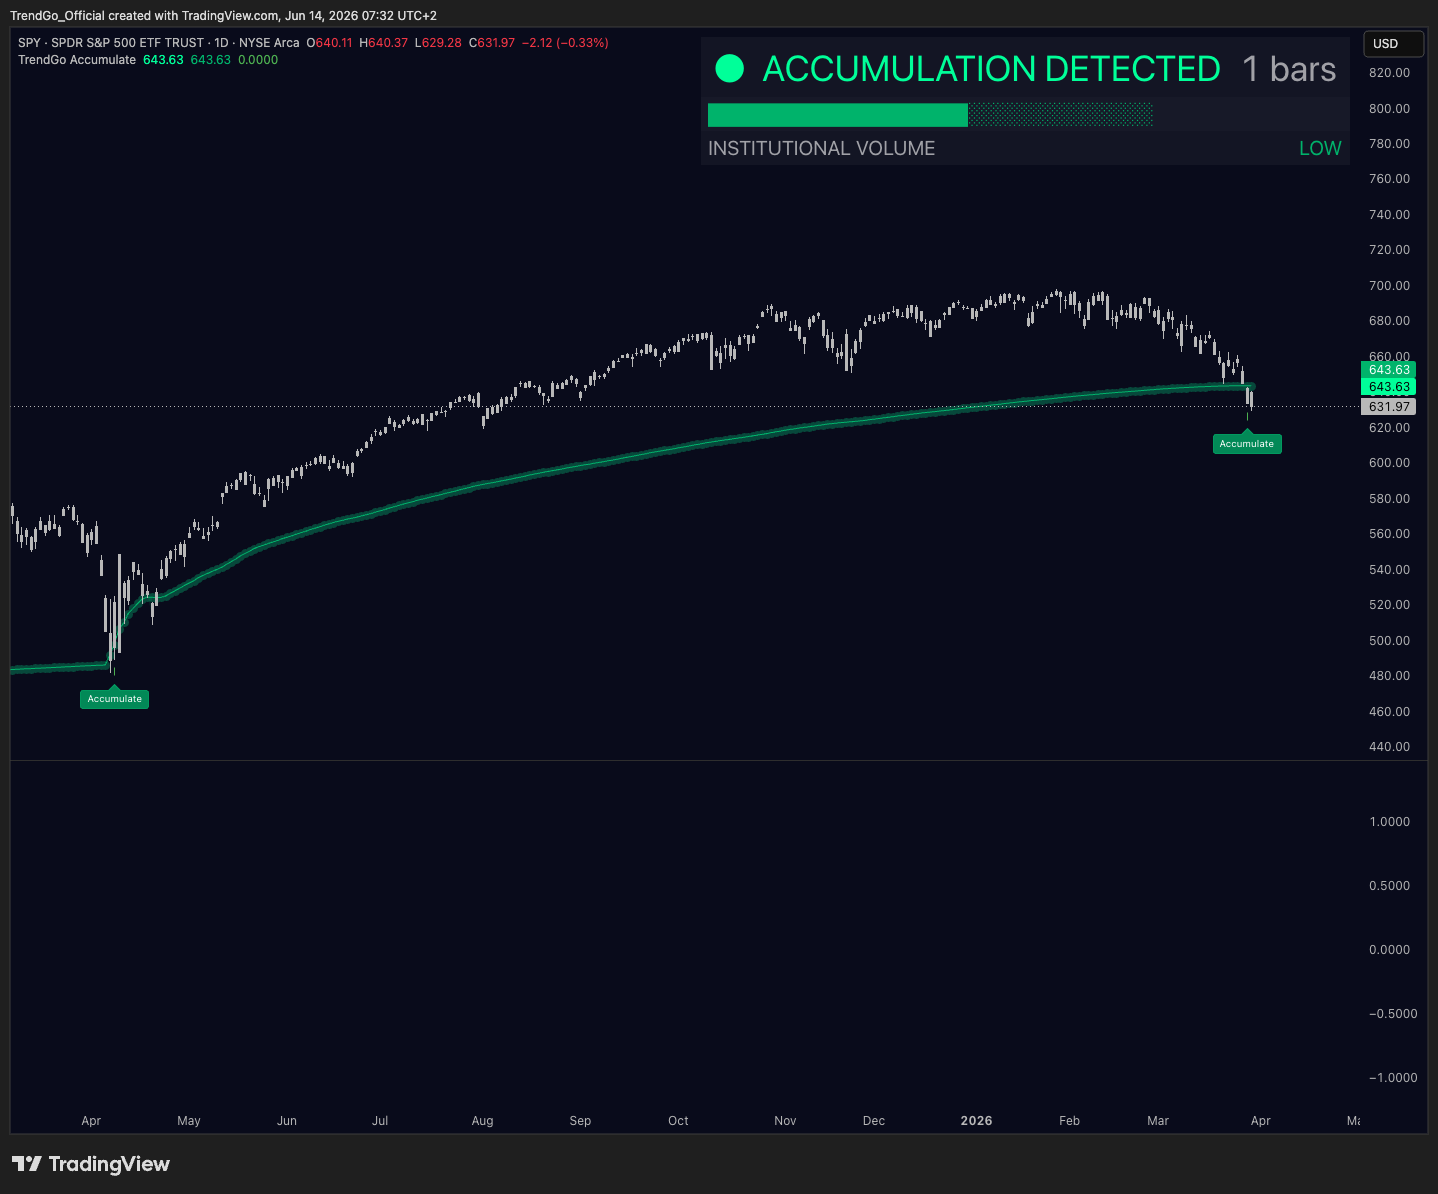
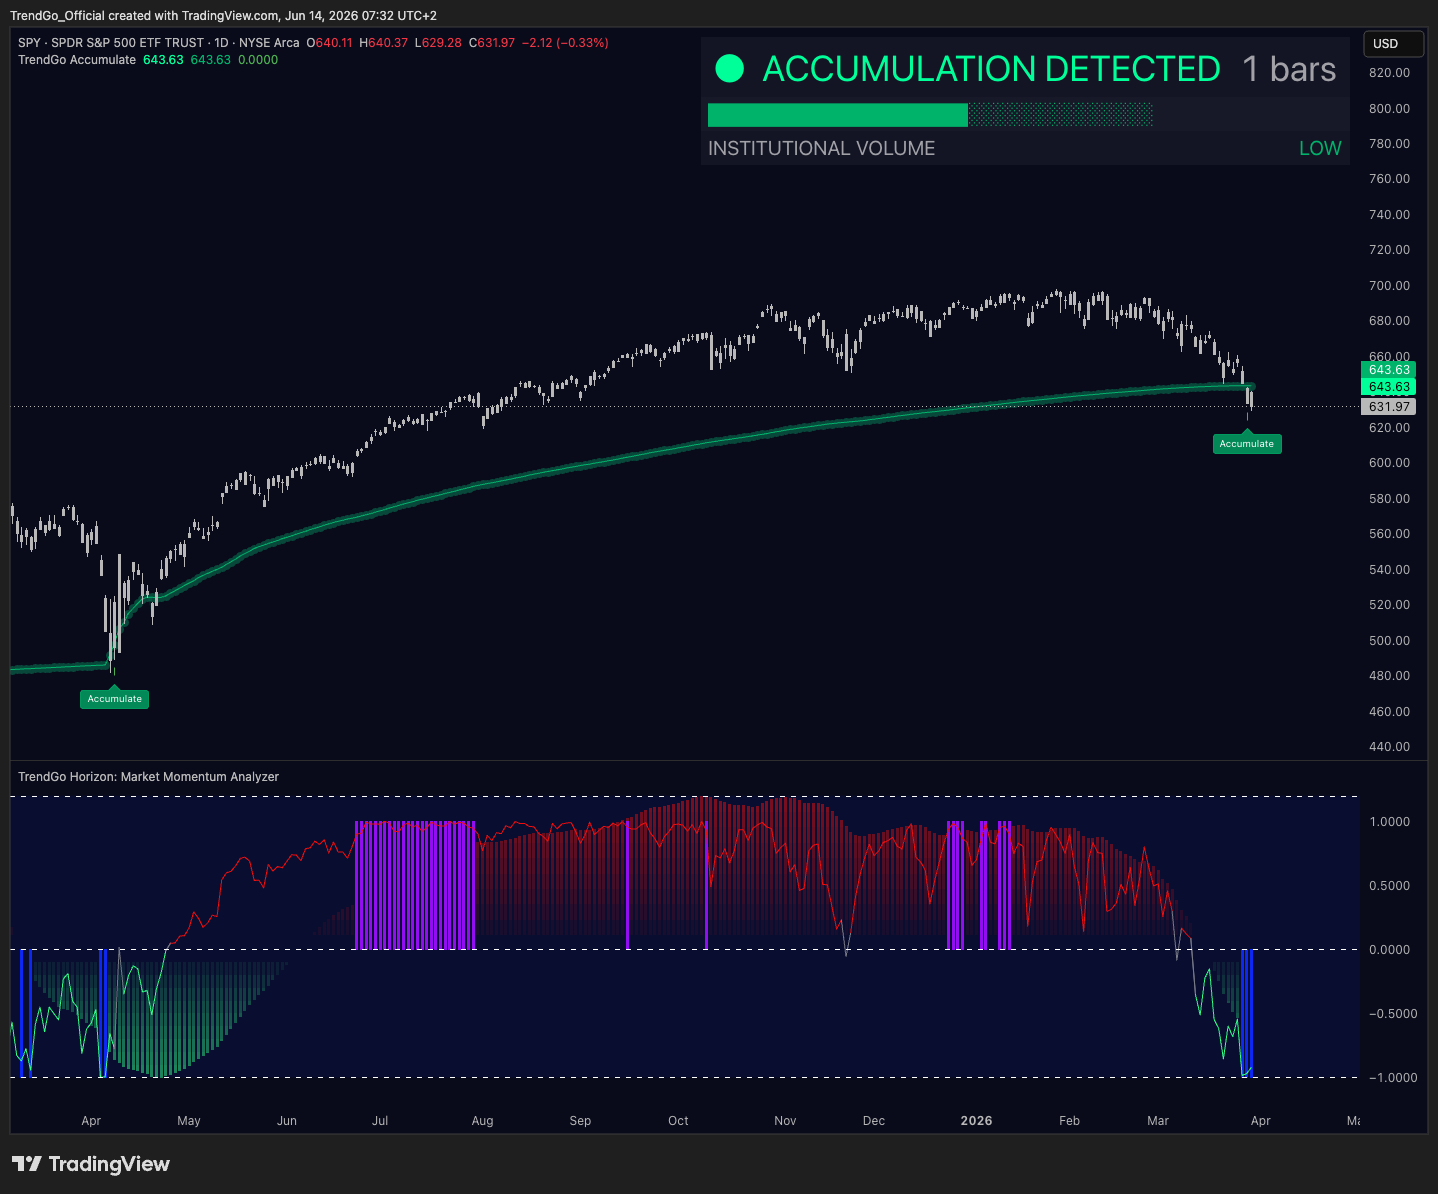
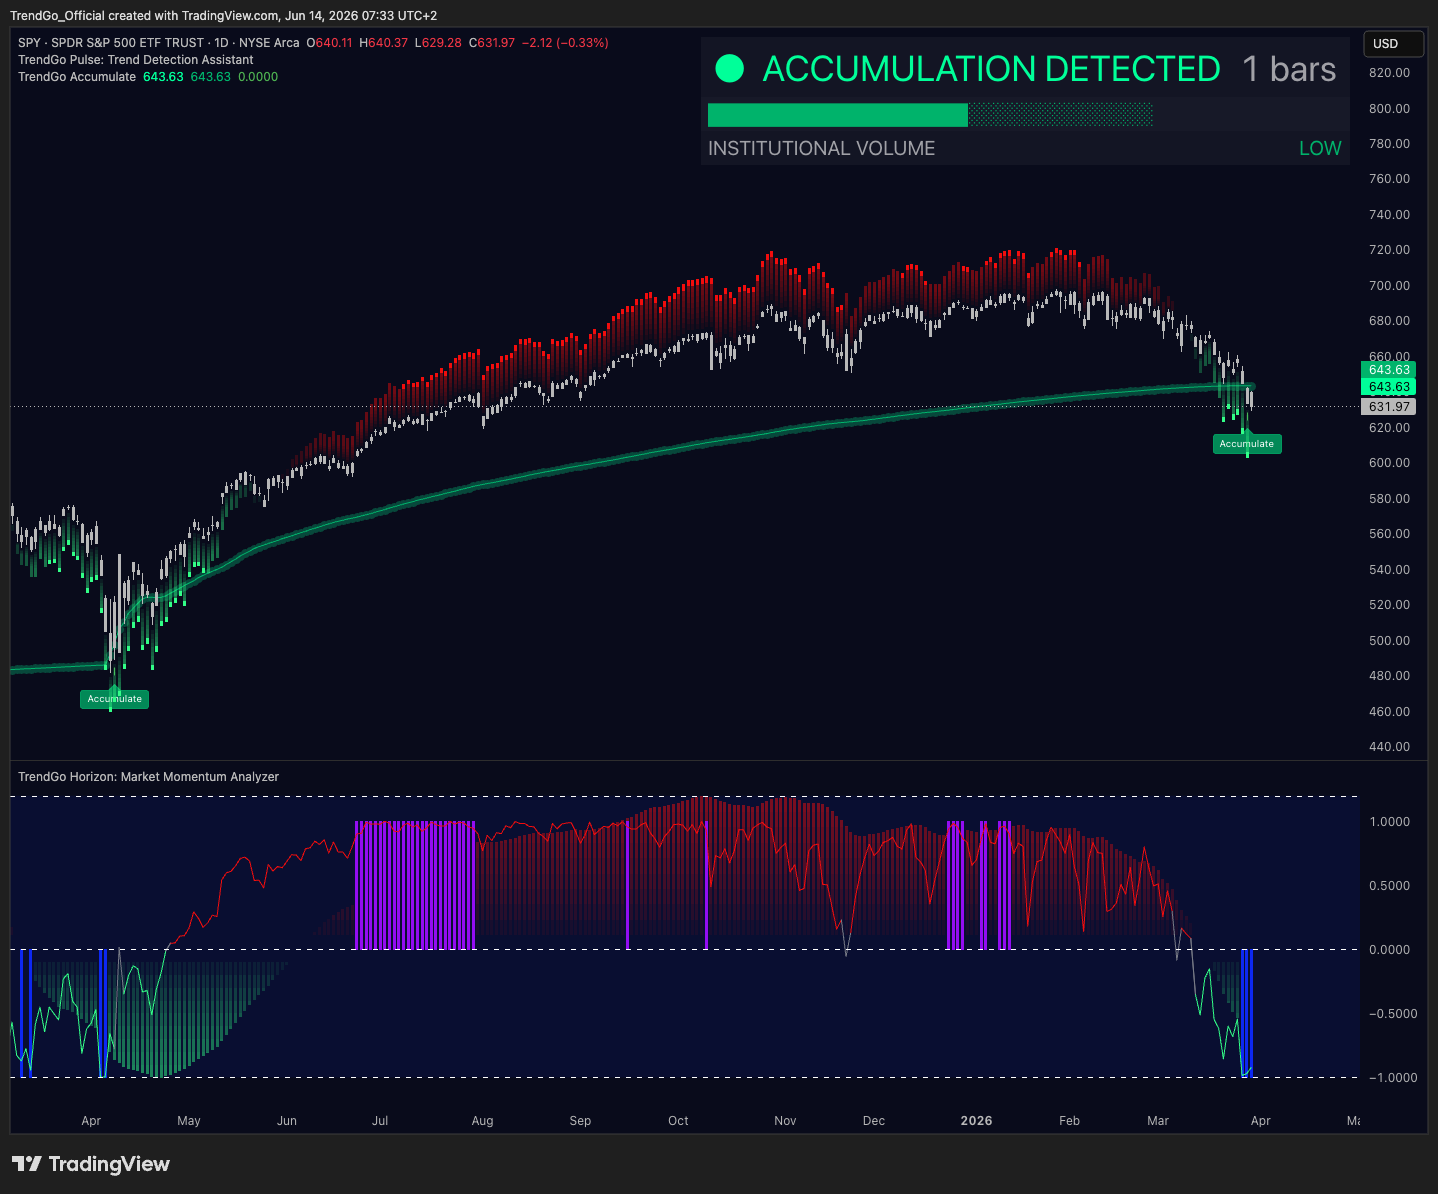
Layer 02
Accumulate detected
Accumulate reveals structure
The Structure step adds the Accumulate layer so users can see where market structure begins to form.
Selected layer
Accumulate
Structure Layer
Accumulate identifies structural areas where price may be stabilizing, rebuilding, or reconnecting with its long-term market structure after a reset.
Full Accumulate page →What it analyzes
price relationship to the Accumulate structure curve
distance between price and structural baseline
compression around the curve
repeated reactions around the same structural area
whether price is expanding away from or reconnecting with structure
What it shows
Accumulate zones
structure curve
distance from structure
accumulation state
institutional volume context
How to read it
Price near the curve = market is reconnecting with structure.
Price stabilizing around the curve = structure may be rebuilding.
Price far above the curve = price may be extended from structure.
Price below the curve = structure is not fully reclaimed yet.
More layers
Two more questions, two more layers.
Liquidity and Squeeze read the chart alongside the four above. Included in Vector and Vantage.
Selected layer
Liquidity
Liquidity Layer
Liquidity identifies support and resistance zones from confirmed swing points, sizes each zone to current volatility, merges revisits into a single zone with a touch count, and removes zones once price closes through them. Only the nearest zones on each side of price are shown.
Full Liquidity page →What it analyzes
confirmed swing highs and lows
zone width relative to current volatility
revisits of the same area, counted as touches
whether price has closed through a zone
distance between price and the nearest zone on each side
What it shows
support zones (green) and resistance zones (red)
nearest zones only, extended right while they hold
on-chart count and tracked count
nearest support and resistance prices
How to read it
Price at a green zone = at a level that has held before.
Price at a red zone = at a level that has capped price before.
A zone disappearing = price closed through it; it is no longer liquidity.
A zone appearing = a swing confirmed a few bars ago, never on the current bar.
Capabilities, outputs, and limits in one place.
A compact reference for the markets, layers, outputs, use cases, and boundaries of the Structura visual system.
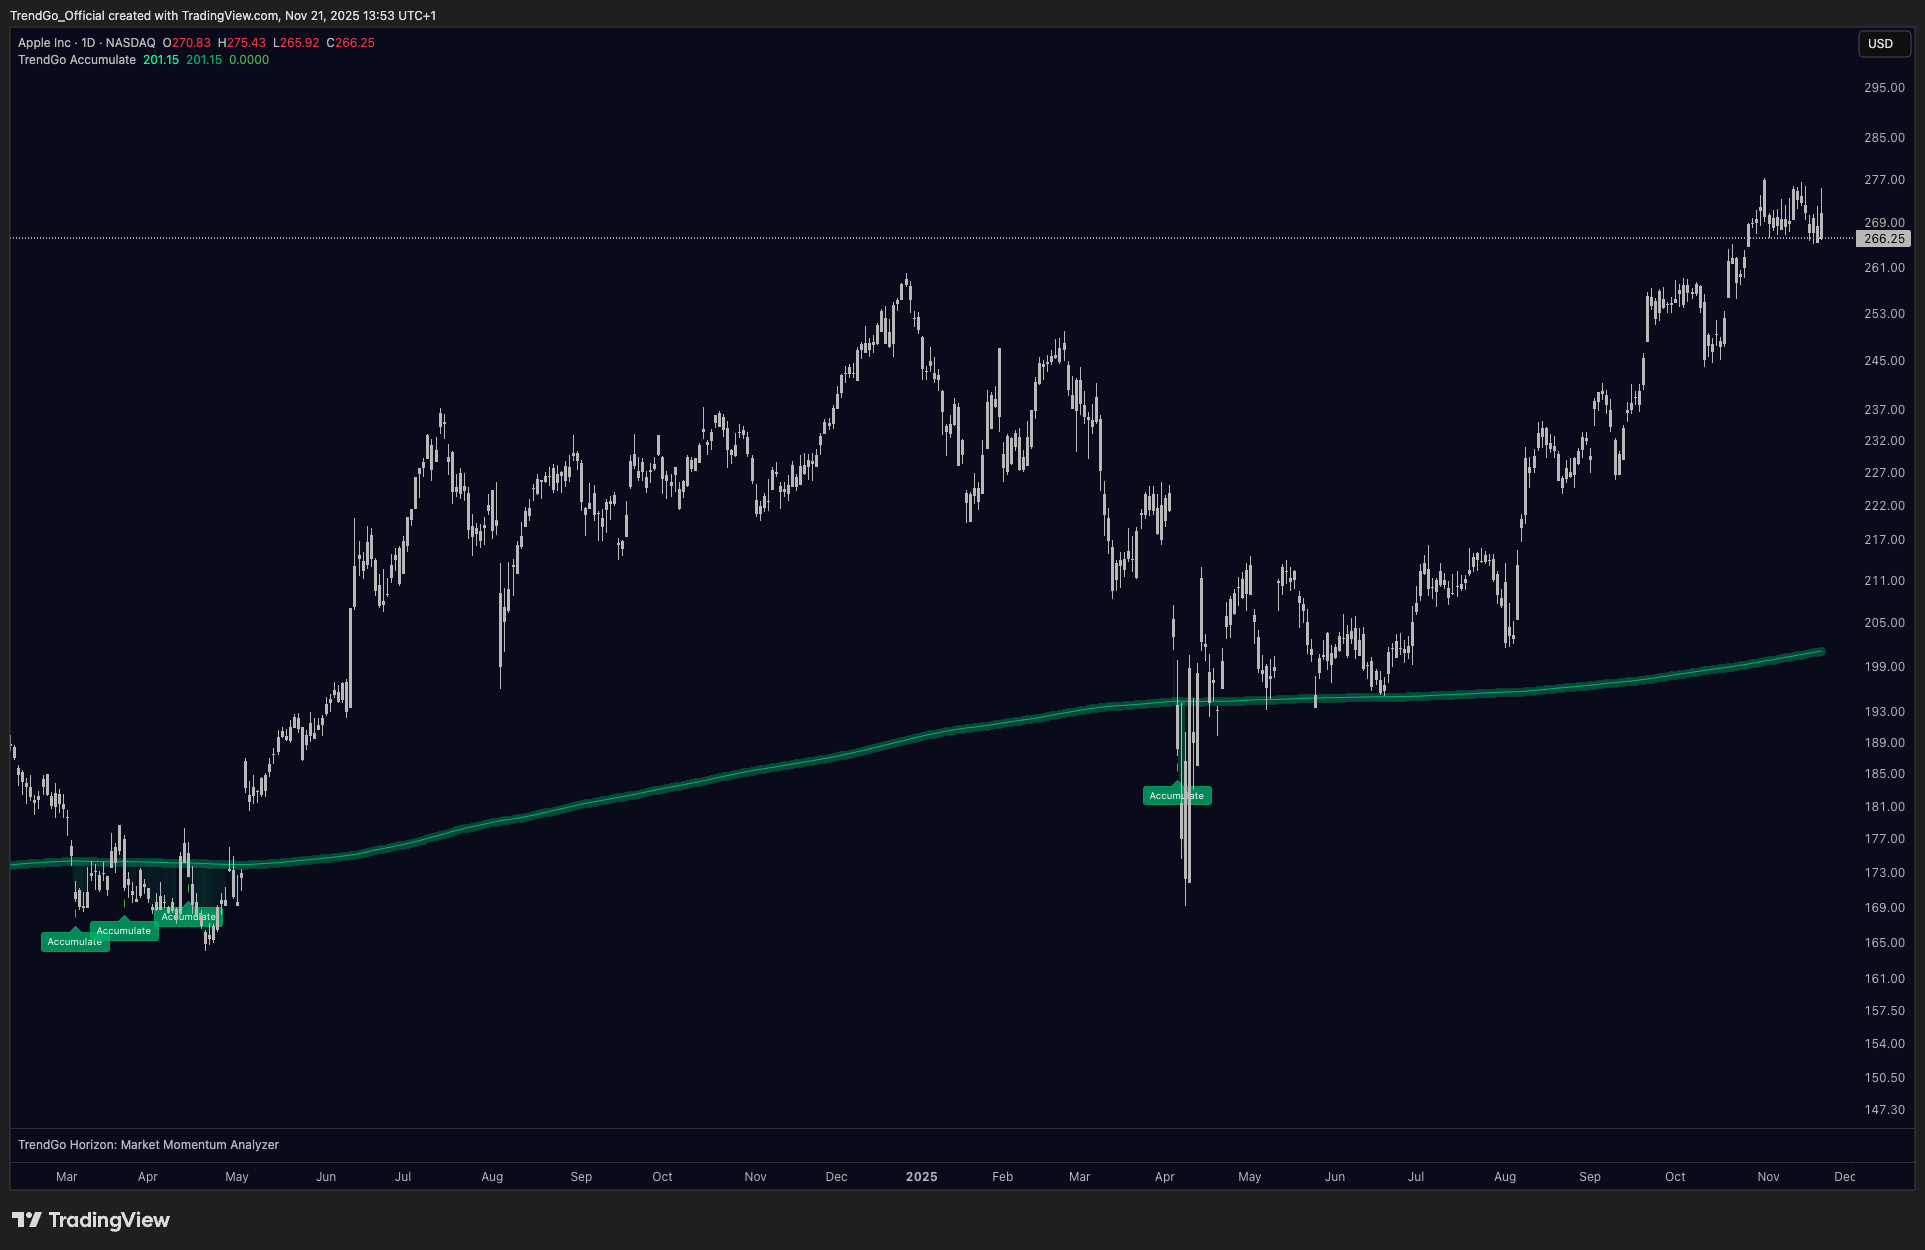
01
Accumulation detection
Accumulate surfaces zones where the market may be rebuilding balance before the next phase becomes visible on the chart.
Structure layer - no buy/sell signals.
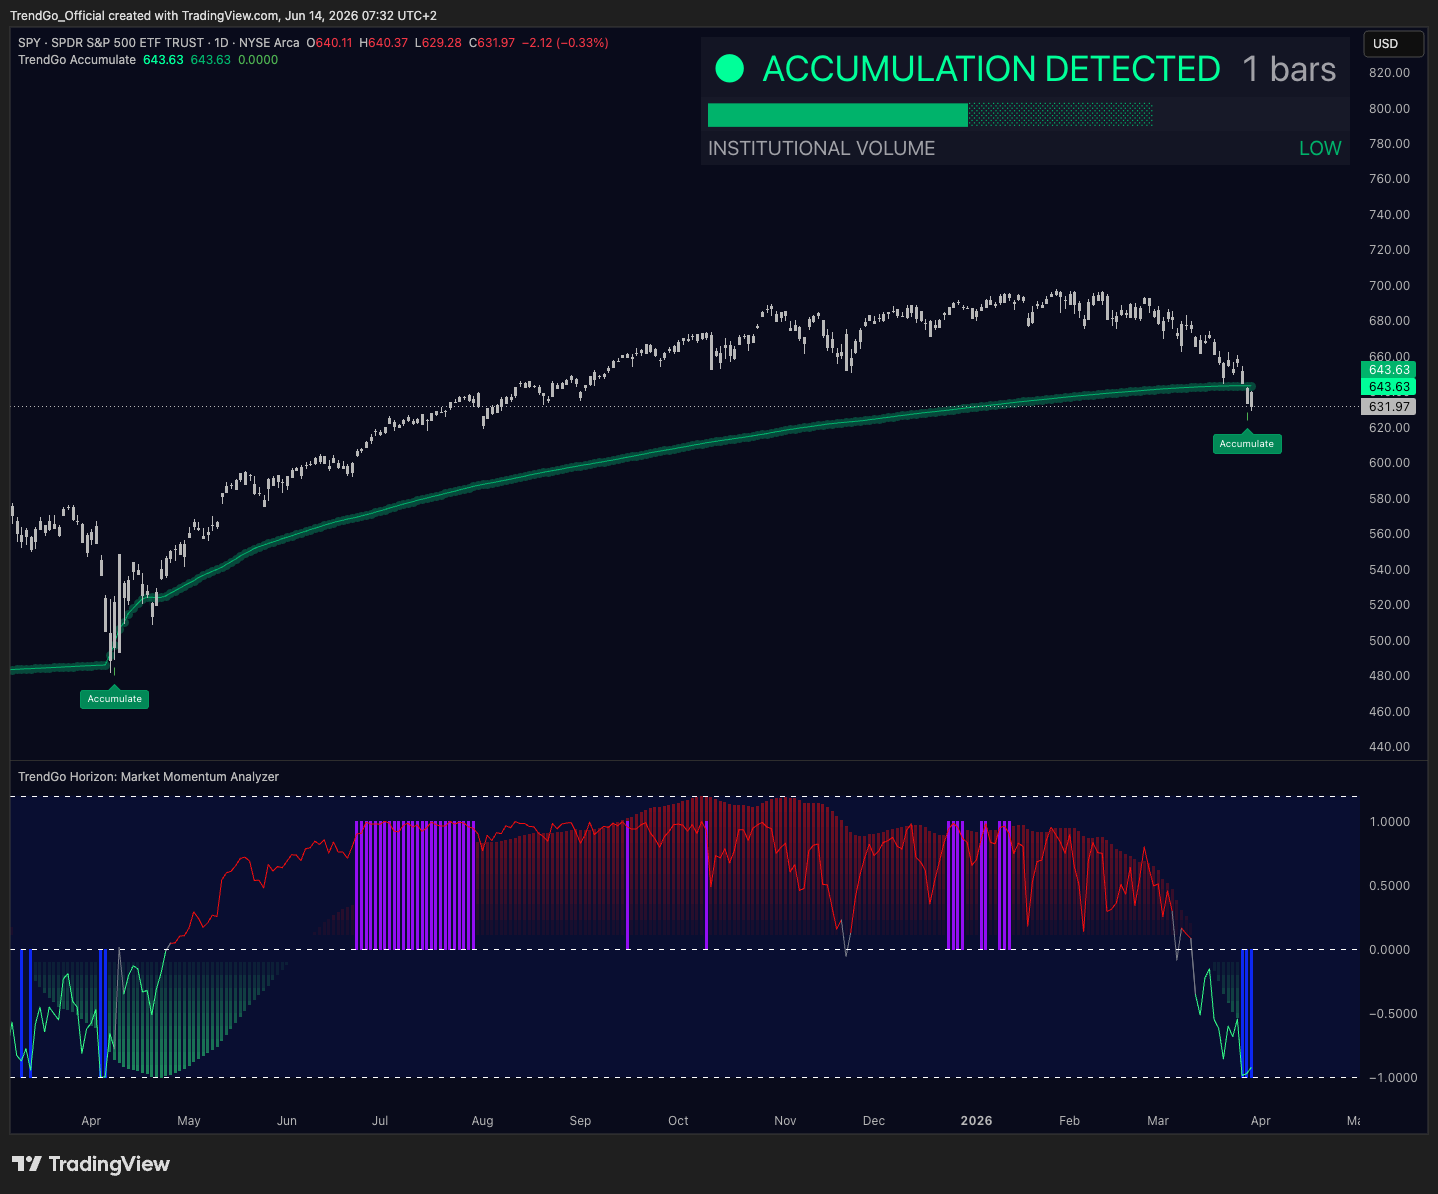
02
Live structure workflow
The live workflow panel shows all six layers in real time - Structure, Volatility, Momentum, Trend, Money Flow, Expansion - with percentage readings.
Always-on context for every chart you open.
03
Structure zone
Structure zones mark where the market is in a preparation phase before expansion, with bullish and bearish context shown directly on the chart.
Preparation before expansion context.
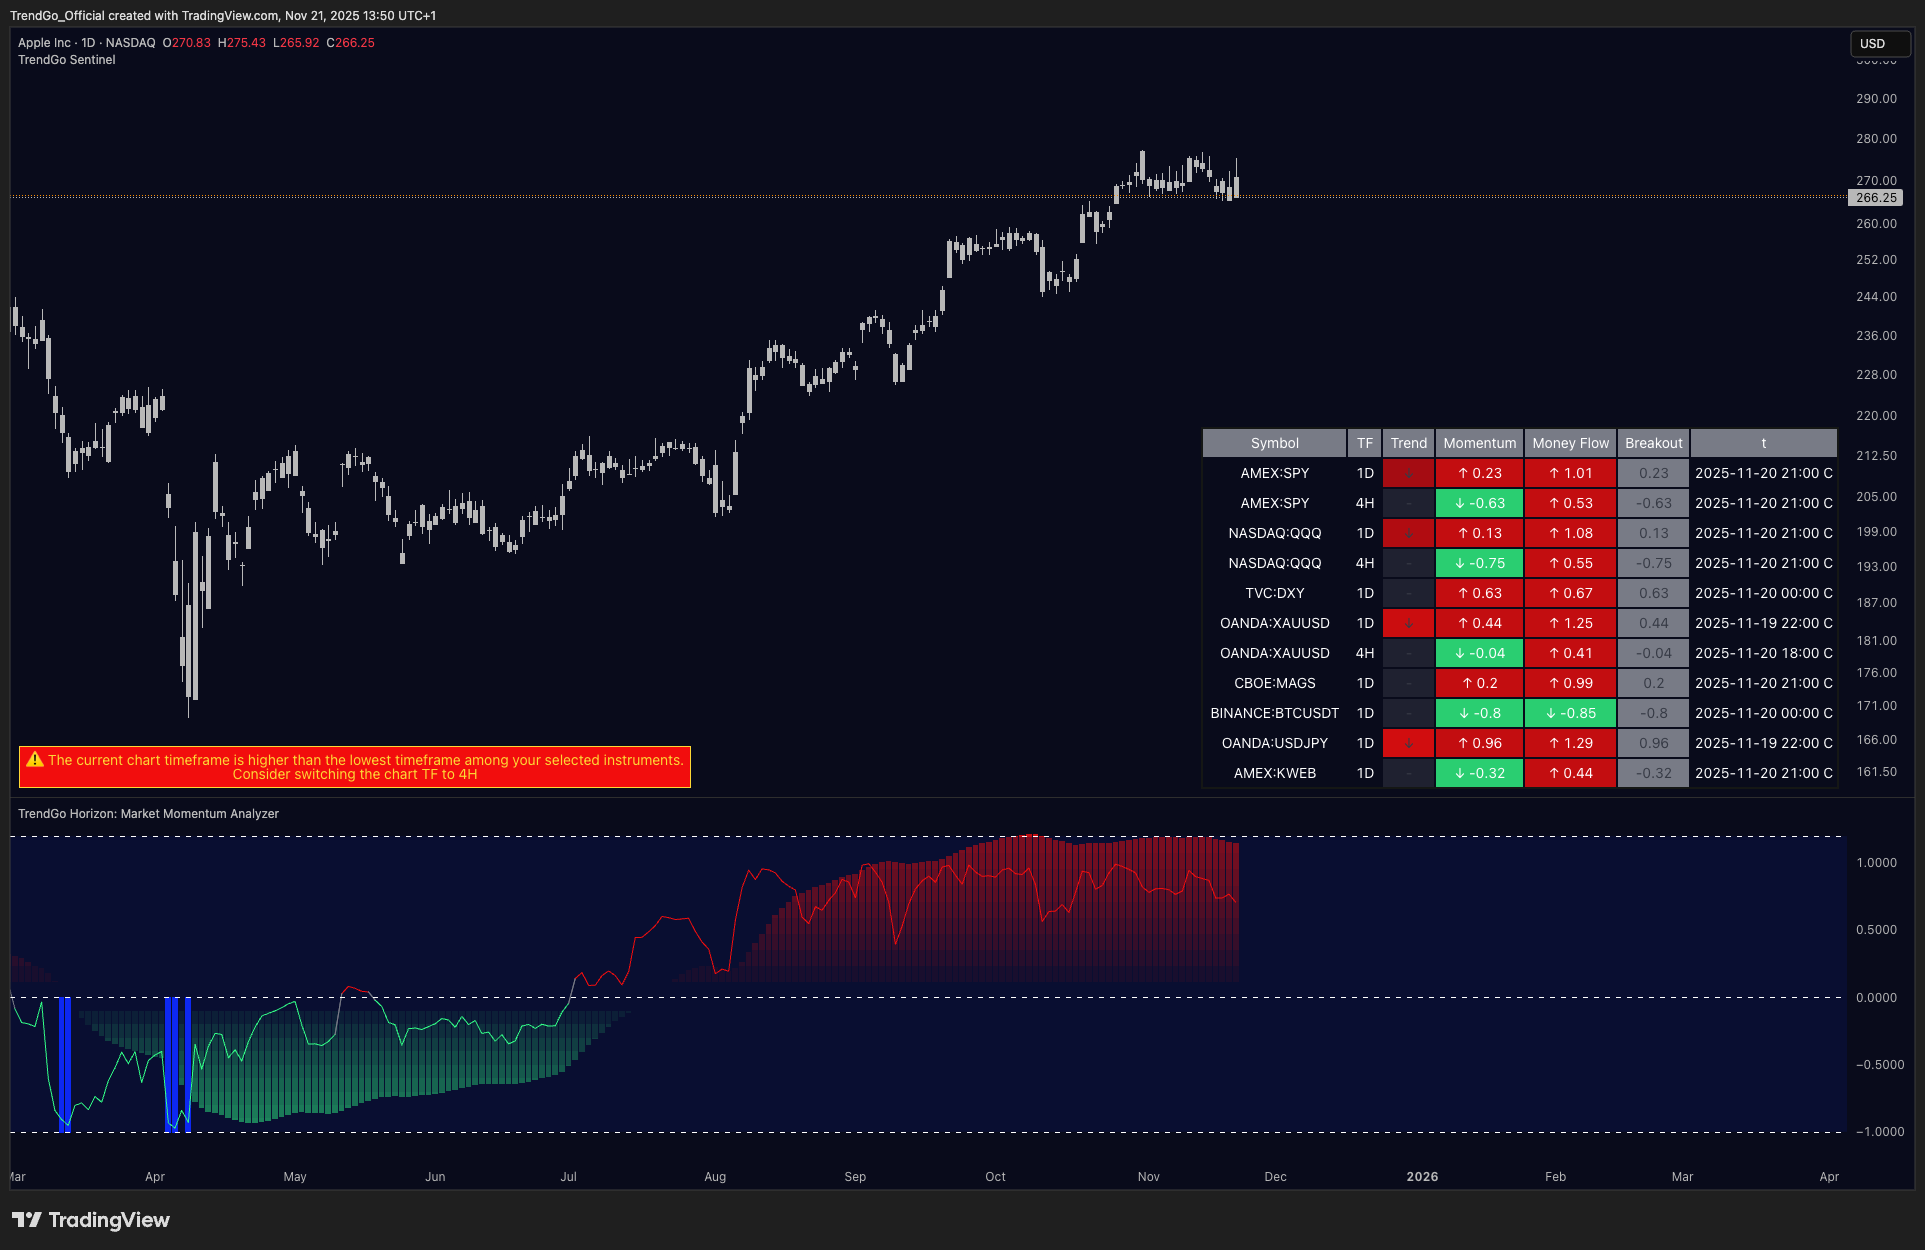
04
Market screener
Sentinel scans multiple markets and timeframes simultaneously - showing Symbol, TF, Status, Momentum, Trend, Money Flow, and Breakout in one table.
Reduce manual scanning time across your watchlist.
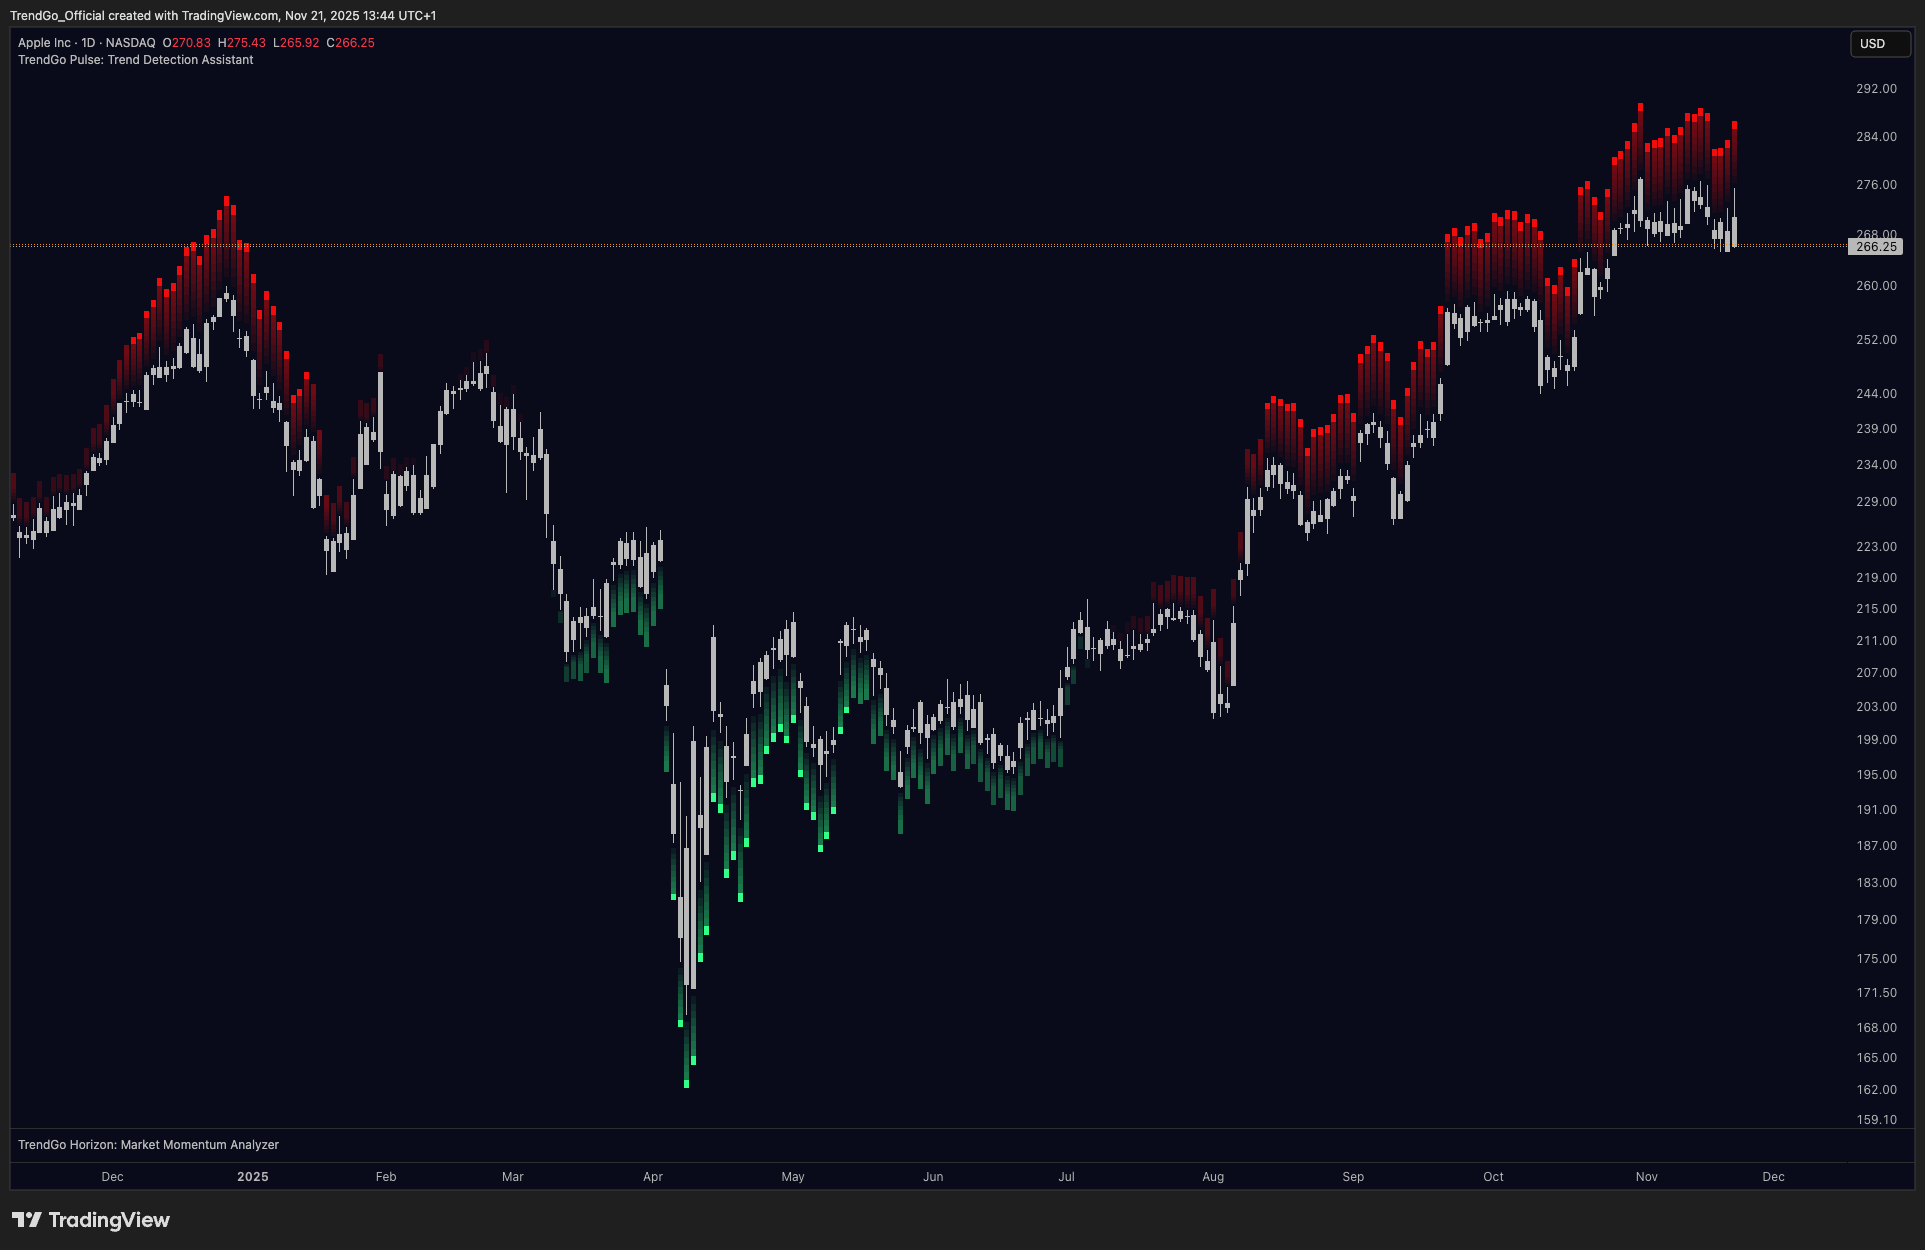
05
Pulse trend detection
Pulse colors each candle to reflect trend behavior phase - red for distribution, green for accumulation - making directional shifts immediately readable.
Trend behavior layer - phase confirmation.
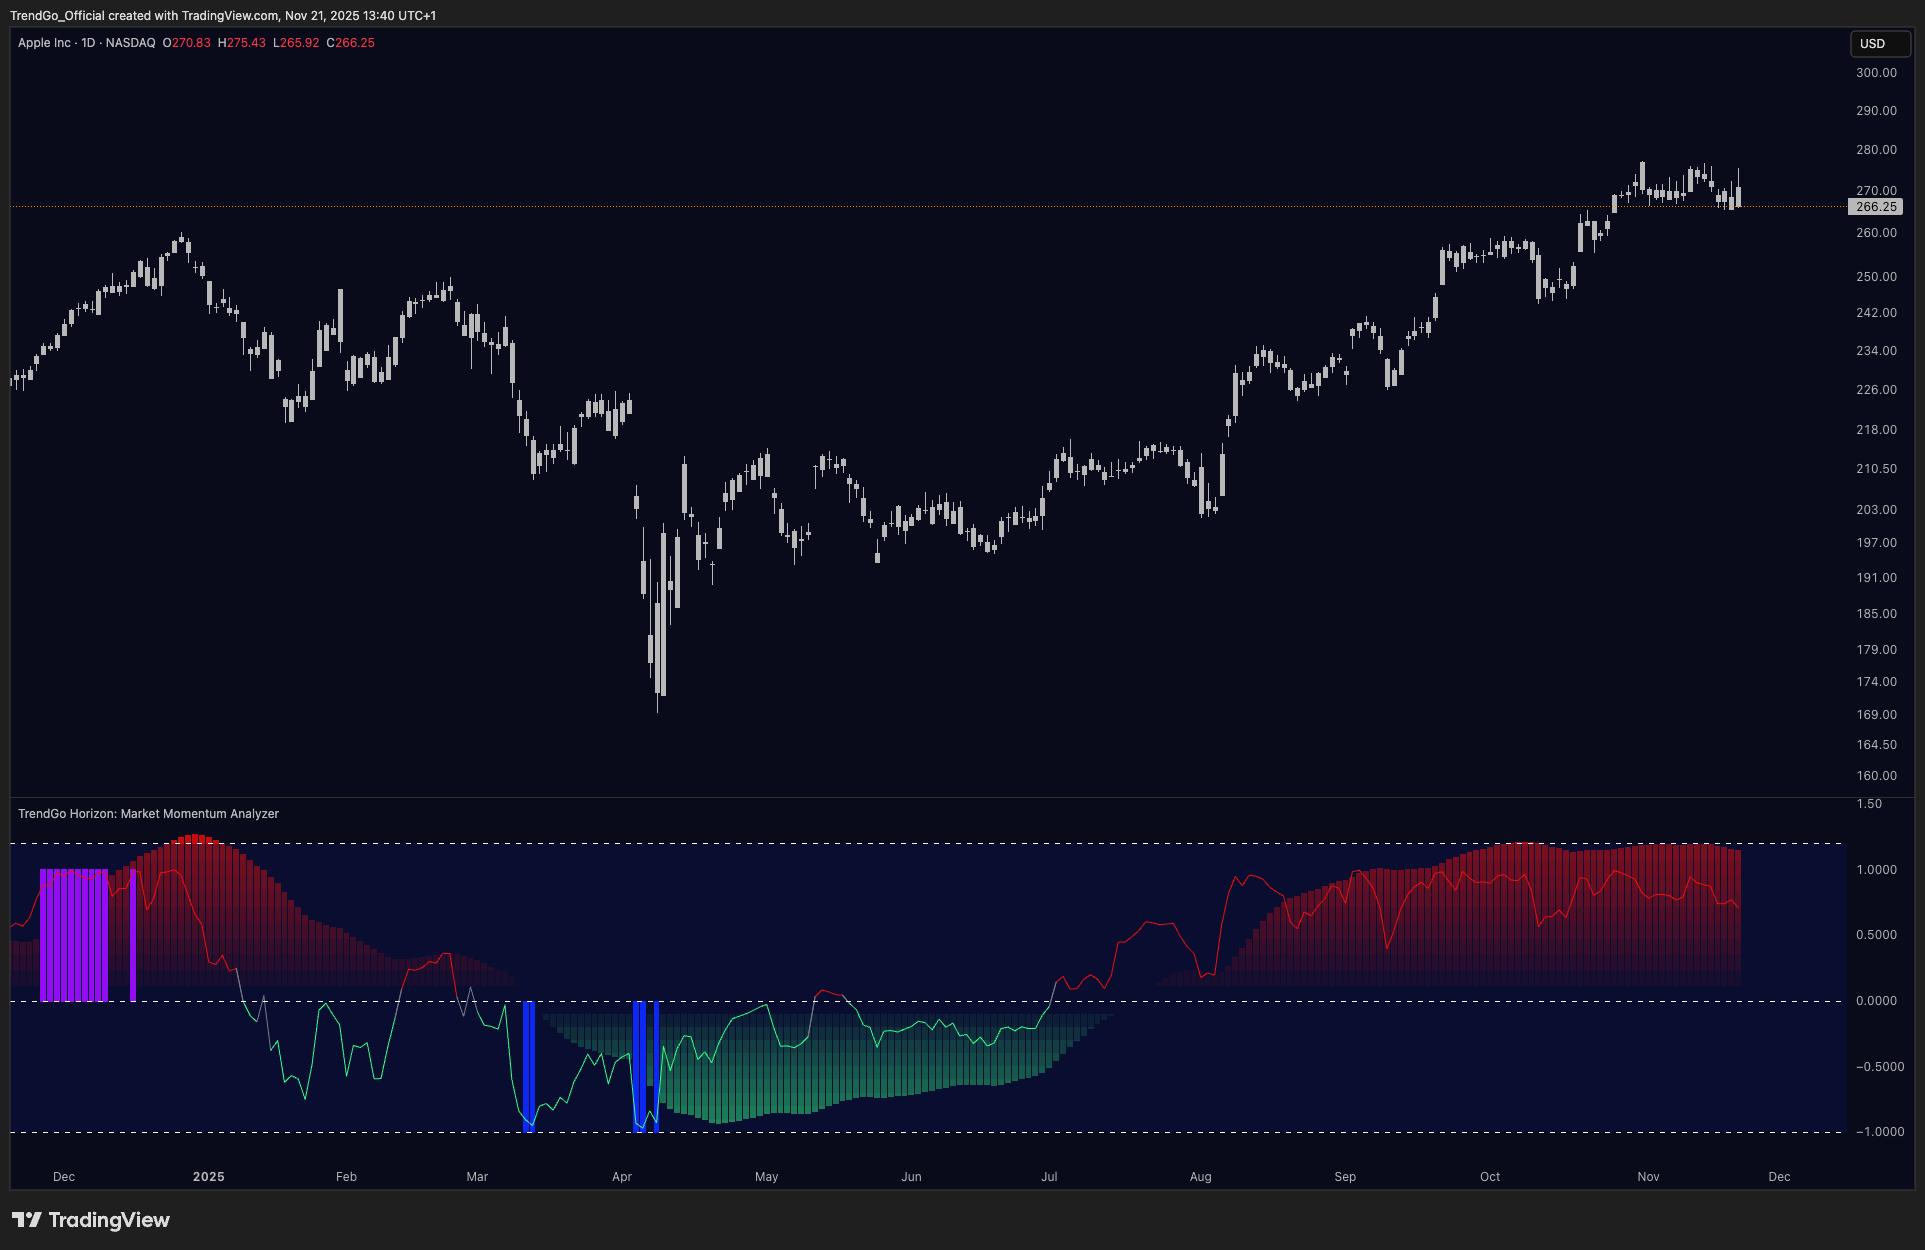
06
Horizon momentum detection
Horizon organizes the momentum read into a histogram so users can assess whether the structural shift is supported by broader transition behavior.
Momentum layer - phase shift and overextension filter.