
A fair value gap is a stretch of price where trade barely happened.
That is the entire idea. Everything else written about them — and a great deal has been written — is commentary on that one sentence. This article explains what a gap is, why it forms, what it can honestly tell you, and what it cannot. It is written by people who build a tool that marks them, so you should read the last section knowing that. The rest stands on its own.
How a gap forms
Price moves because one side runs out of participants.
In an orderly market, buyers and sellers meet across a range of prices. Every level in that range gets tested. Someone is willing to sell at each step up and someone is willing to buy at each step down, and the tape grinds through them.
Sometimes that does not happen. A large participant needs to move size quickly. A number is released. A position is liquidated. Price relocates instead of negotiating, and it skips a range of levels on the way. Nothing meaningful traded in the skipped range — the market passed through it without agreeing on anything.
That skipped range is the gap.
On a candlestick chart it is usually identified with three consecutive candles. When the middle candle moves far enough that the wick of the first candle and the wick of the third candle do not overlap, the space between those two wicks is the gap. It is a visual way of asking a simple question: is there a band of prices here that the market moved through rather than traded in? For a fuller explanation of how to read the gap's age and location, see how to track the gap rather than the level.
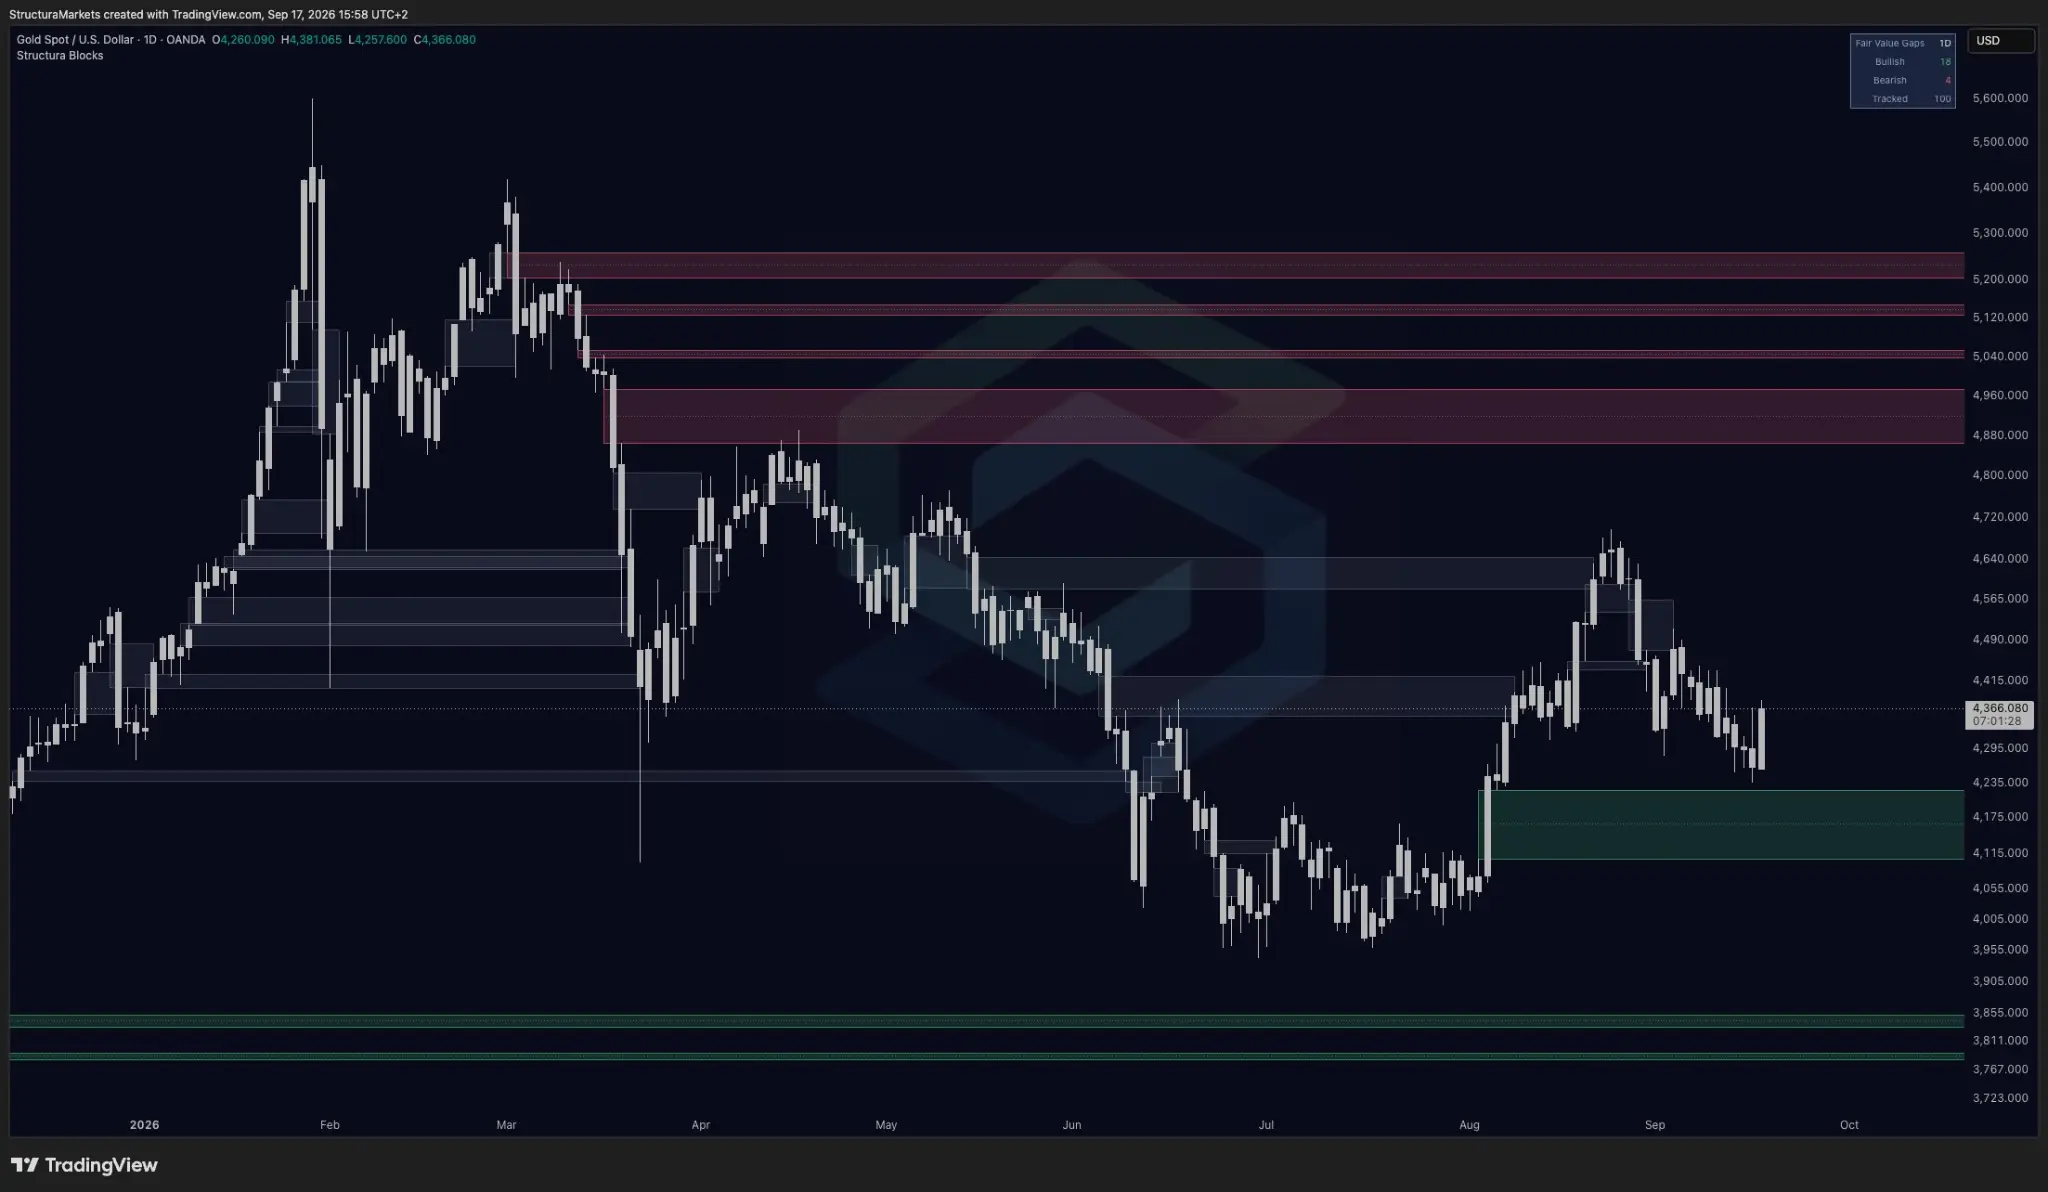
The name comes from the idea that in that band, no fair value was established. There was no negotiation — only relocation.
What people say gaps mean
The common claim is that price returns to fill them.
The reasoning is intuitive. If the market moved through a range without transacting, there is unfinished business there — participants who wanted to trade at those levels and never got the chance. When conditions calm, price drifts back to where that business was left.
Sometimes this happens. It happens often enough that the idea has become one of the most widely traded concepts in retail technical analysis, and often enough that you will find hundreds of charts online where a gap was filled and the fill marked a turn.
You will also find a number attached to it. Search for this topic and something will tell you that a specific percentage of fair value gaps get filled.
Why we do not publish that number
We have not measured a fill rate we would be willing to put our name on, and we would rather say so than repeat someone else's.
The reason is not laziness. A fill rate is one of those figures that looks objective and is almost entirely a function of how you chose to measure it. Consider what has to be decided before the number exists.
What counts as filled? Price touching the near edge of the gap is one answer. Trading halfway through is another. A candle closing beyond the far edge is a third. These produce very different percentages on the same data.
Over what window? A gap that is unfilled after a week may be filled after a year. Any study has to stop counting at some point, and where it stops moves the answer.
On which instrument and which timeframe? Gaps on a five-minute chart in a liquid future behave nothing like gaps on a weekly chart in a thin small cap.
And which gaps were in the sample? This is the one that matters most and gets mentioned least. If a study looks only at gaps that eventually resolved, it has answered a different question than the one you asked.
Change any of those decisions and the headline number moves a long way. A figure that fragile is not knowledge. It is a decoration.
More importantly, even a correct fill rate would not help you. Knowing that some proportion of gaps in a historical sample were eventually filled tells you nothing about the one on your chart right now.
What a gap can honestly tell you
It is a record, not a forecast.
A gap marks a place where the market relocated rather than negotiated. That is a fact about what already happened, and it is worth having for two reasons.
Location. Marked gaps give you a map of where price has unfinished business, above and below. That is context. It is not a set of targets, and treating it as one is the single most common mistake made with this concept.
Age. This is the part almost nobody shows you, and it is the more useful of the two.
A gap that formed this morning and a gap that formed seven months ago are not the same object. The old one has survived every rally and every selloff since it appeared. The market has had many opportunities to come back for it and has not taken any of them. That is information about how the market is treating that area, and it accumulates quietly over time.
The reason you rarely see it is mechanical. Most tools that draw these zones delete them once price trades back through. The chart then shows only the gaps that are currently open, with no sense of how long each has been waiting and no record of the ones that resolved. It is a chart that has quietly edited its own history.
How to read one without predicting
Three questions are usually enough.
Where is it relative to price? Above, below, and how far. A gap eleven percent away is a different consideration from one that price is sitting inside.
How long has it been there? Days, weeks, or months. Age does not make a gap more likely to fill. It tells you how persistently the market has declined to deal with it.
What else agrees? A gap on its own is one observation. Whether momentum, trend or participation are saying anything compatible is a separate question, and the gap does not answer it. If you want an example of how easily one indicator gets credited with information it does not contain, we wrote about that in Does money flow lead price?.
Four common mistakes
Treating an unfilled gap as a target. The gap marks where the market left something behind. It makes no claim about being reached.
Treating a fill as a signal. Price trading back through a gap is an event, not an instruction. Plenty of fills lead nowhere.
Using gaps alone. They describe one narrow property of price behaviour and are silent on everything else.
Dropping to smaller timeframes for more of them. A five-minute chart will produce far more gaps than a daily chart. Almost all of that extra supply is noise, and the impulse to find more signals by looking closer is how most people end up with worse ones.
How we mark them
We build a free layer called Blocks that draws these zones, and it makes two choices worth explaining, because both come out of what is above.
Zones extend to the right for as long as they go untouched, so the width of a zone is its age. You read how long a gap has survived without being told.
And when price finally trades back through one, the zone does not disappear. It turns grey and stays on the chart. We do this because a record you can only see when it flatters the tool is not a record. Leaving the resolved ones visible is what allows you to judge the open ones.
What it will never tell you is that a gap gets filled. Not whether, not when, not how far. That is not a limitation we are apologising for — it is the only honest position available, and any tool that claims otherwise is selling you a number as fragile as the one we declined to publish above.
Blocks is free on TradingView, alongside the rest of our free layers.
Common questions about fair value gaps
How long does a fair value gap last?
A fair value gap has no expiry date. It remains part of the chart until price trades through it, but simple existence is not the useful measure. A gap formed this morning and one formed seven months ago are different records because the older one has survived more candles without being revisited. Its significance fades as more candles pass, not because a timer ends, but because the market keeps declining to deal with that area.
Do fair value gaps always get filled?
No honest reading can say that they do, and we do not publish a fill-rate statistic. The numbers circulating online usually depend on hidden choices: what counts as a fill, how long the study runs, which instruments and timeframes are included, and whether the sample excludes gaps that remain open. Change any of those decisions and the percentage changes. A historical proportion, even if measured carefully, would still not answer what the current gap will do.
What is the difference between a fair value gap and an imbalance?
In most charting discussions, they describe the same underlying observation: price moved through a range with little two-sided trade. Different schools prefer different names, often because they emphasise different explanations for the same three-candle structure. The label does not change the candles, the location, the age, or the fact that the area records past behaviour. In practice, the useful questions remain the same regardless of which term appears above the chart.
Is a fair value gap a trading signal?
No. A fair value gap is a record of where price relocated without establishing much trade across a band. It tells you where that happened and, if the chart preserves history, how long the area has remained unresolved. It does not tell you to enter, exit, wait, or expect a return. Treating a marked location as an instruction adds a conclusion the data does not contain. The gap is context for reading, not a signal to act.
Educational market commentary — not financial advice.
Read us first in your Google results:
Free on TradingView
Get the free structure layer.
Structura Accumulate marks where the market may be rebuilding structure before the move becomes obvious.
See the free tools