
Structura tools
Liquidity
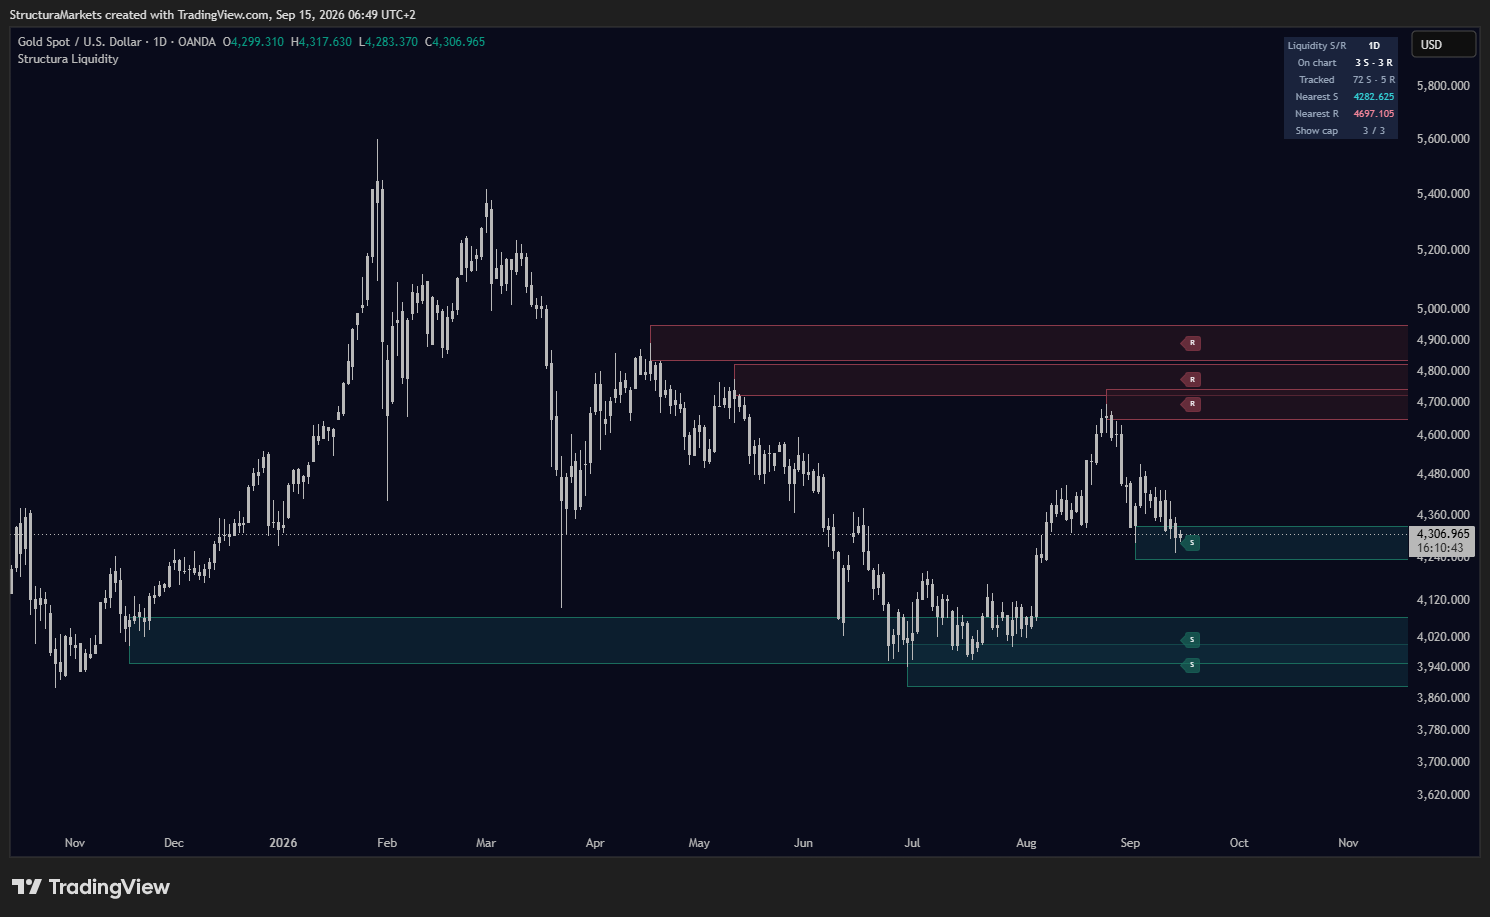
Liquidity marks the levels the market keeps returning to, tracks how each one behaves, and removes it once price trades through - so the chart shows what has been respected, not everything that ever happened.
What it reads
- confirmed swing highs and lows
- zone width relative to current volatility
- revisits of the same area, counted as touches
- whether price has closed through a zone
- distance between price and the nearest zone on each side
What it shows
- support zones (green) and resistance zones (red)
- nearest zones only, extended right while they hold
- on-chart count and tracked count
- nearest support and resistance prices
How to read it
- Price at a green zone = at a level that has held before.
- Price at a red zone = at a level that has capped price before.
- A zone disappearing = price closed through it; it is no longer liquidity.
- A zone appearing = a swing confirmed a few bars ago, never on the current bar.
What it will not do
- Liquidity is not a level to trade from. It is the map of where the market has kept coming back.
Where it sits in the system
How to get it
Liquidity and Squeeze (new)