
Structura tools
Squeeze
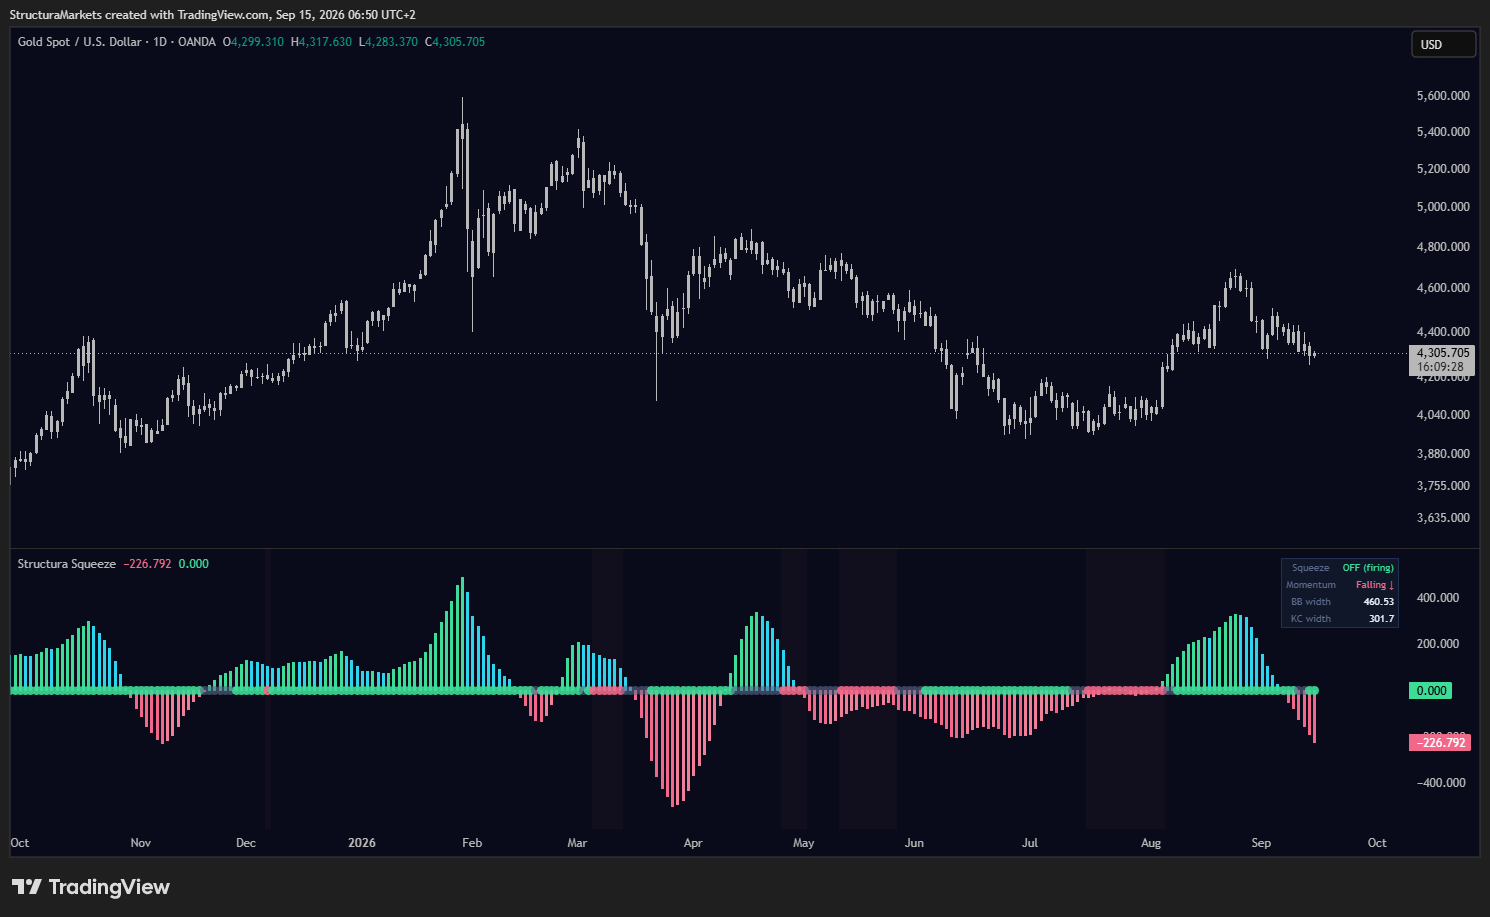
Squeeze marks the periods when volatility contracts and the market goes quiet before it moves - and the moment they end - while reading whether momentum is building, slowing, falling, or recovering.
What it reads
- whether volatility is compressed, released, or neither
- momentum direction and whether it is building or fading
- the transition through the zero line
- how long the current compression has lasted
What it shows
- momentum histogram in four colors
- state dots: compression on, released, in between
- background tint across every compression phase
- panel with state and momentum direction
How to read it
- Red dots and tint = compression on; the market is quiet.
- Green dots = compression just released; volatility is expanding.
- Grey dots = neither; do not read it as a squeeze.
- Histogram color = momentum regime, not a trade instruction.
What it will not do
- Squeeze is not a breakout signal. It is the volatility layer of the system.
- Which way. A release is an event; direction is read from momentum, and momentum can be wrong. Some releases lead nowhere and compress again.
Where it sits in the system
How to get it
Both are in Vector and Vantage.