
Structura tools
Horizon
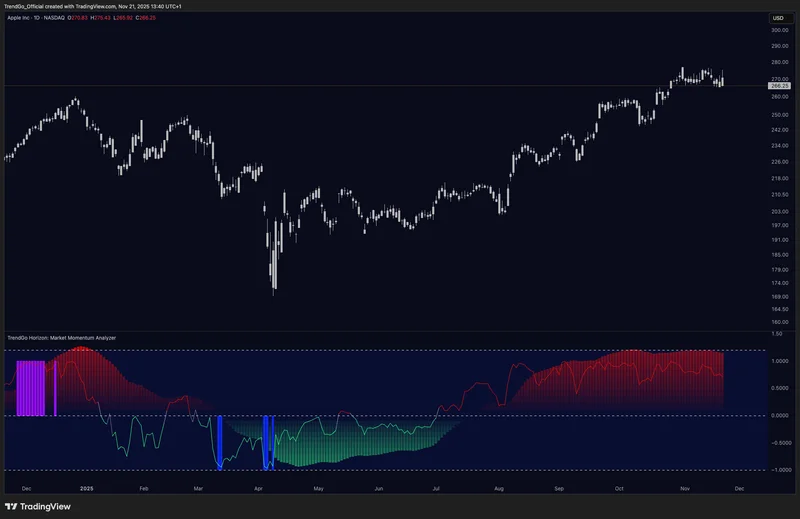
Horizon reads the momentum condition behind price, helping traders understand whether the market is washed out, recovering, overheated, or weakening.
What it reads
- momentum direction
- momentum intensity
- overbought / oversold conditions
- rate of momentum recovery
- momentum compression and expansion
- shifts around the zero line
What it shows
- momentum histogram
- momentum line
- overbought / oversold bands
- recovery from weakness
- blue / purple confirmation bars for extreme zones
How to read it
- Deep green lower zone = momentum is washed out.
- Rising green line = momentum recovery from weakness.
- Red upper zone = momentum is extended / overheated.
- Zero-line reclaim = possible momentum regime shift.
- Blue vertical bars = increased downside volatility / oversold pressure.
- Purple vertical bars = reduced volatility / potential exhaustion around upper zones.
What it will not do
- Horizon does not predict reversals. It provides momentum context.
- Momentum extremes are not entries. Horizon reaching overbought or oversold is a condition, not a trigger. Wait for the histogram to turn and confirm.
Where it sits in the system
How to get it
Horizon, Pulse and every free layer