
Education
Best Free TradingView Indicators for Market Structure
Most lists of free TradingView indicators cover the same ground: a moving average, an RSI, a VWAP, a volatility band. Good tools, and almost silent about the question many traders open a chart to answer: where is the market rebuilding, where did it leave gaps behind, and where is the move no longer supported by what is underneath it. That is market structure, and it is the category most lists skip.
This page is organised by that question. Three of the indicators below are ours - Structura Accumulate, Blocks and Divergence. We say so here, in the second paragraph, rather than in a footnote. They are free, public or invite-only, with no lite version and no locked features. Next to each of them we list the TradingView built-in tool that comes closest to the same job, so you can judge for yourself. In the categories where we have no free tool, the list is built-ins only.
One rule applies to everything on this page: an indicator describes a condition. None of the tools here, ours or TradingView's, tells you what to buy, when to enter, or where a move ends.
Read us first in your Google results:
How this list was put together
Four criteria, in this order. The indicator had to be free in full - not a trial, not a version with the useful part locked. It had to draw on confirmed data, so that what you see today is still in the same place tomorrow. It had to have a clear answer to "what does this not read", because a tool that claims to read everything reads nothing well. And it had to work on any market and any timeframe without retuning. We did not score indicators on how often they are right, because that number depends on the trader more than on the tool.
Quick comparison
| Category | Tool | Free on TradingView? | What it reads | What it does not read | When it stays silent | Repaints? | Get it |
|---|---|---|---|---|---|---|---|
| Structure | Structura Accumulate | Yes, public | Price against the structure curve, distance from it, compression and repeated reactions around it | Direction, timing, targets, whether a zone holds | When nothing is rebuilding below structure | No | Open script |
| Imbalance zones | Structura Blocks | Yes, public | Ranges price moved through without two-sided trade, zone age, whether price traded back through | Whether, when or how far a gap gets filled | In an orderly market where every level gets tested | No - zones are drawn from completed candle sequences and filled zones stay | Open script |
| Divergence | Structura Divergence | Yes, invite-only | Confirmed pivots, the momentum behind each, whether price and momentum agree | The outcome; it does not rank divergences or predict reversals | When no pivot qualifies | No - confirmed pivots only, history never recalculated | Free tools |
| Structure | Anchored VWAP (built-in) | Built into TradingView | Volume-weighted average price from a point you choose | Zones, age, whether a level was respected | n/a - always draws from the anchor | No | Built into TradingView |
| Imbalance zones | Gaps (built-in) | Built into TradingView | Price gaps between consecutive bars | Zone age, fill history, how the gap formed | n/a - always draws | No | Built into TradingView |
| Divergence | RSI with divergence (built-in) | Built into TradingView | Disagreement between one oscillator and price, regular only | Participation or volume behind the move; hidden divergences | n/a - labels every qualifying pivot | Labels appear with a delay, then stay | Built into TradingView |
Free. No trial, no card. One signup with your TradingView username.
Structure: where the market is rebuilding
Structura Accumulate (free, public)
Accumulate is the structure layer. It identifies areas where price may be stabilising, rebuilding, or reconnecting with its long-term market structure after a reset. On the chart it draws a structure curve and marks the zones where price is positioned below it, with a reading of how far price sits from that reference.
Accumulate is public on TradingView. Full description on the Accumulate tool page; the reading rules are in the manual.
Open Accumulate on TradingView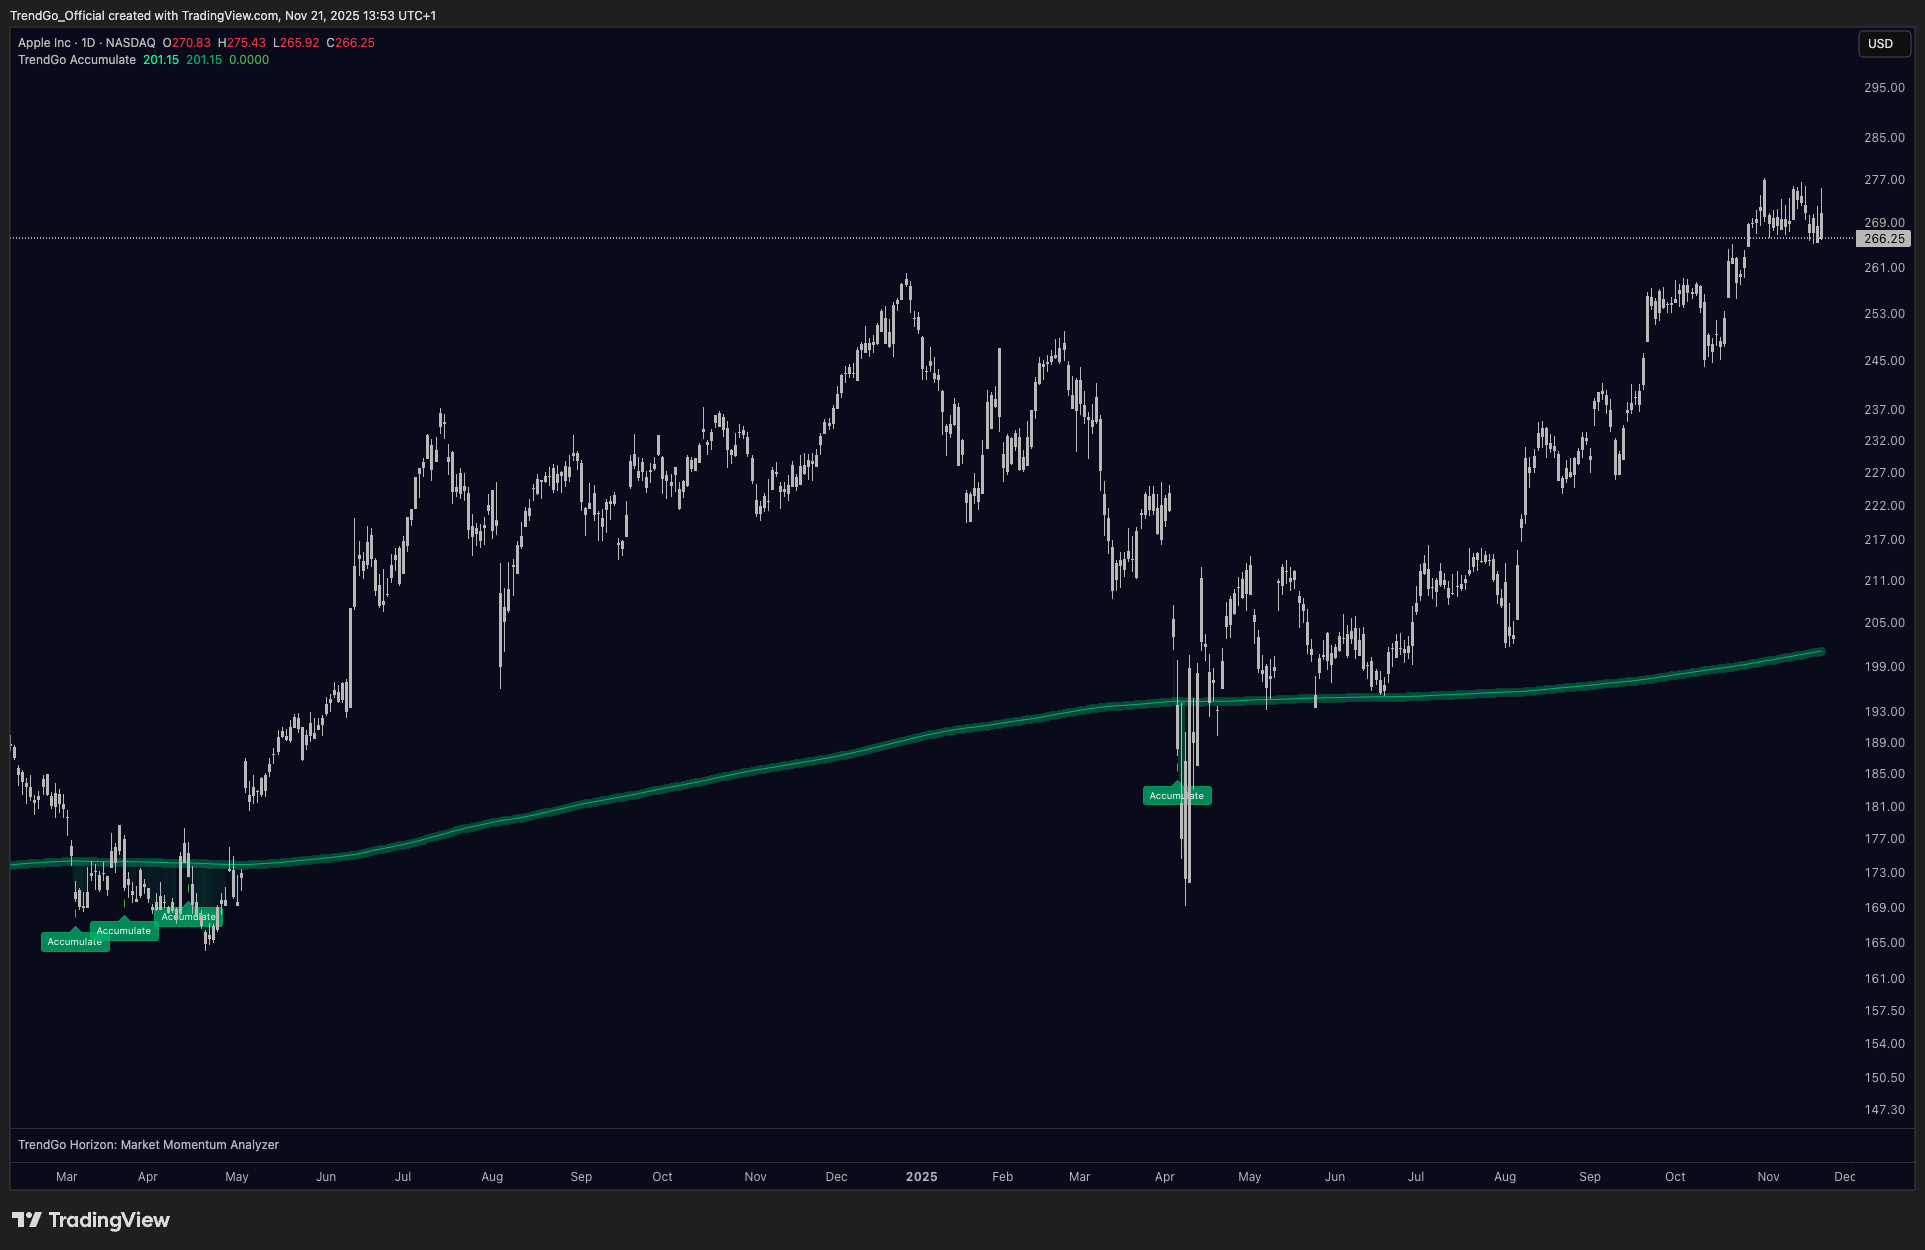
Built-in alternative: Anchored VWAP
TradingView's Anchored VWAP is a drawing tool, not an indicator, but it answers a neighbouring question: from a point you choose, where is the volume-weighted average price. It gives you a reference line; it does not mark zones, does not track how long price has stayed near that reference, and it depends entirely on where you anchor it. A second opinion on "is price far from a reference", not a structure layer.
Imbalance zones: the gaps price left behind
Structura Blocks (free, public)
Blocks marks the imbalances price leaves behind when it moves too fast to trade fairly - the gaps that form when one side simply is not there. Each zone stretches to the right for as long as it goes untouched, so its width is its age. When price finally trades back through one, it turns grey and stays on the chart instead of disappearing.
Blocks is public on TradingView. If you searched for a free fair value gap indicator, this is the one; the terminology is explained in our fair value gap article.
The reading rules are in the manual.
Open Blocks on TradingView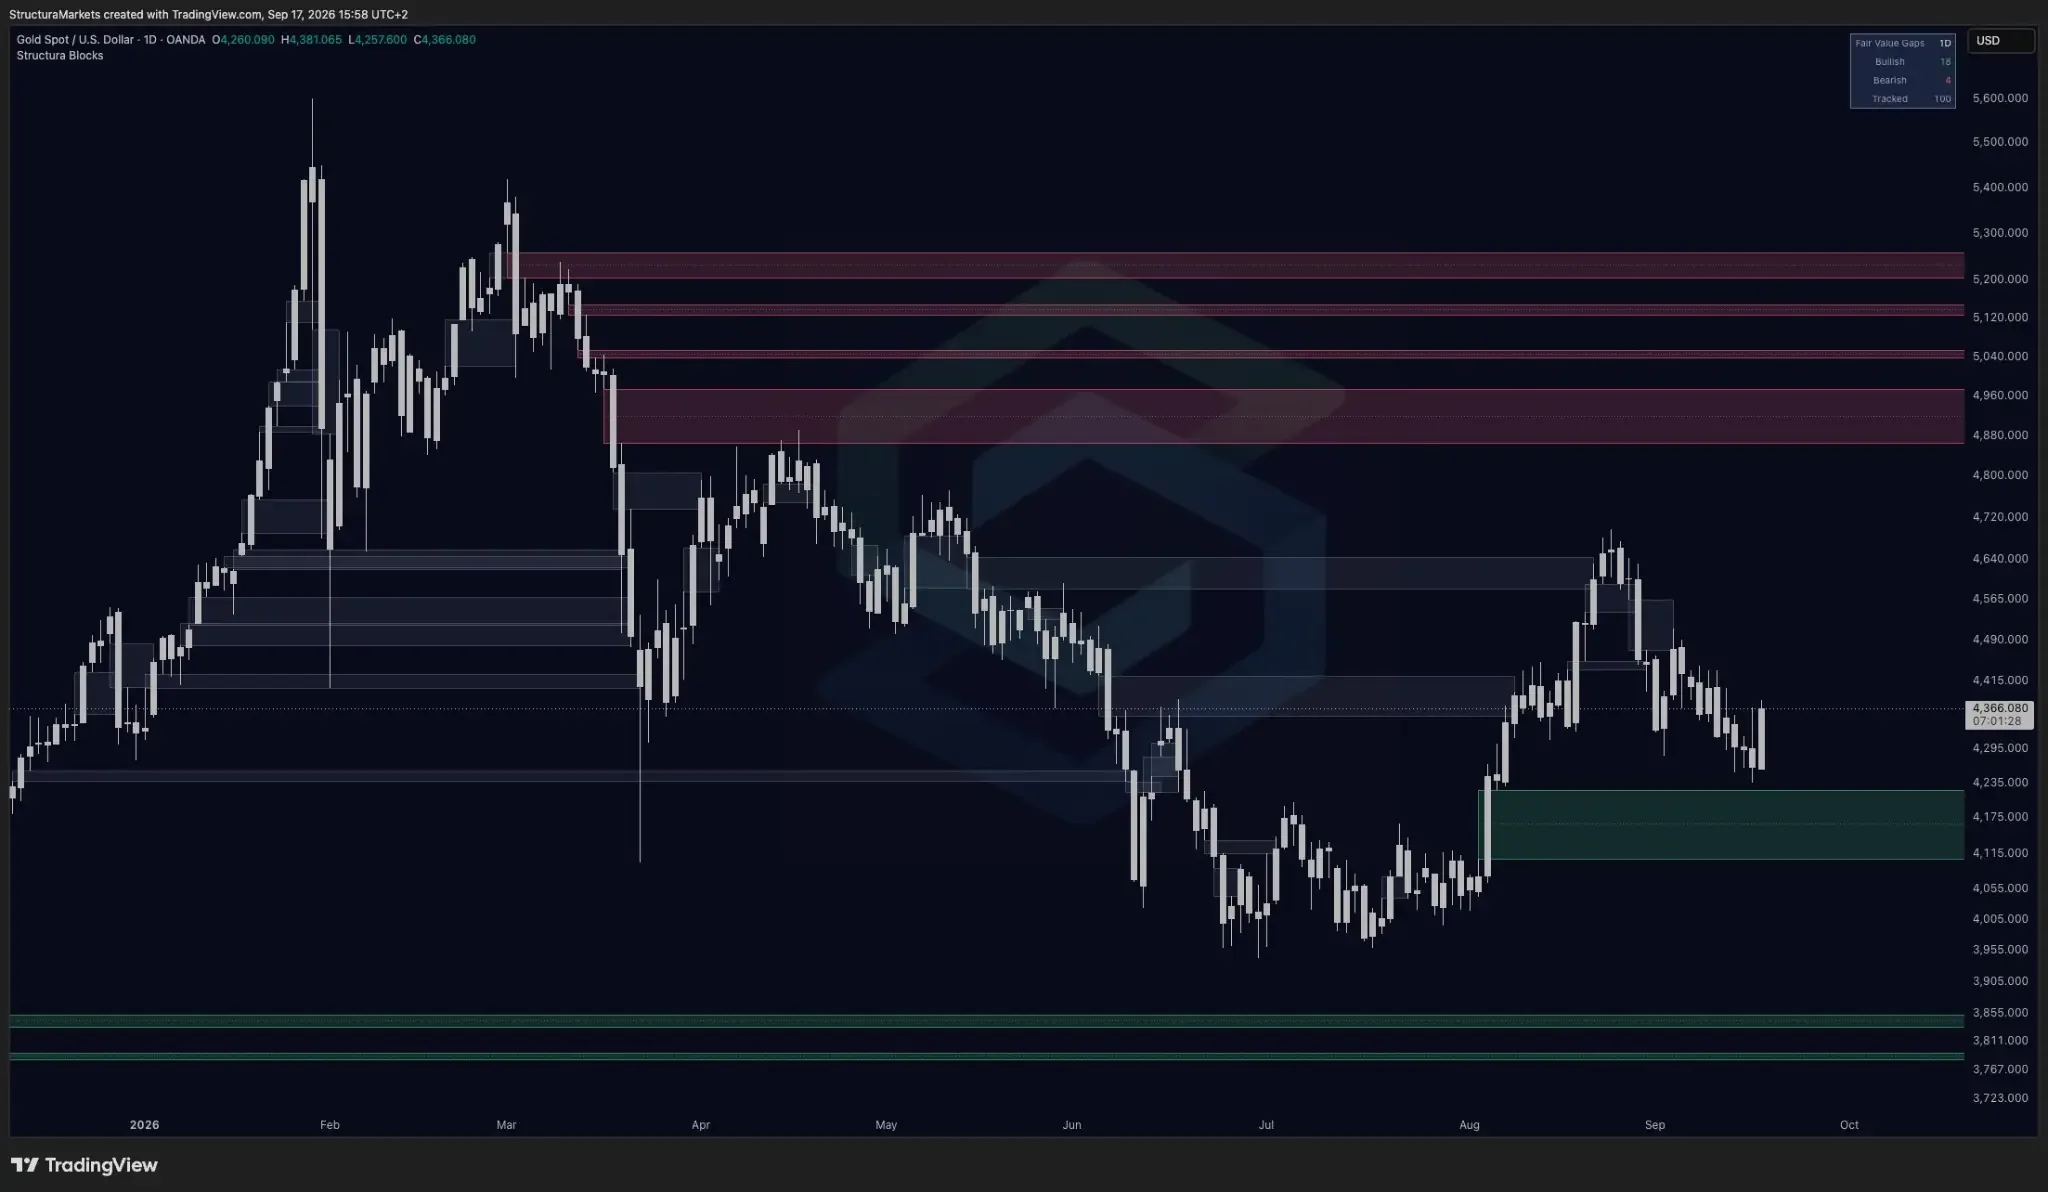
Built-in alternative: Gaps
TradingView ships a built-in Gaps indicator. It marks price gaps between bars and has its own settings for how long a gap is kept on the chart. It does not show how old a zone is, it does not keep a record of the ones that were filled, and it does not distinguish an imbalance inside a candle sequence from a simple overnight gap. If all you need is "there was a gap here", it is enough.
Divergence: when price and momentum disagree
Structura Divergence (free, invite-only)
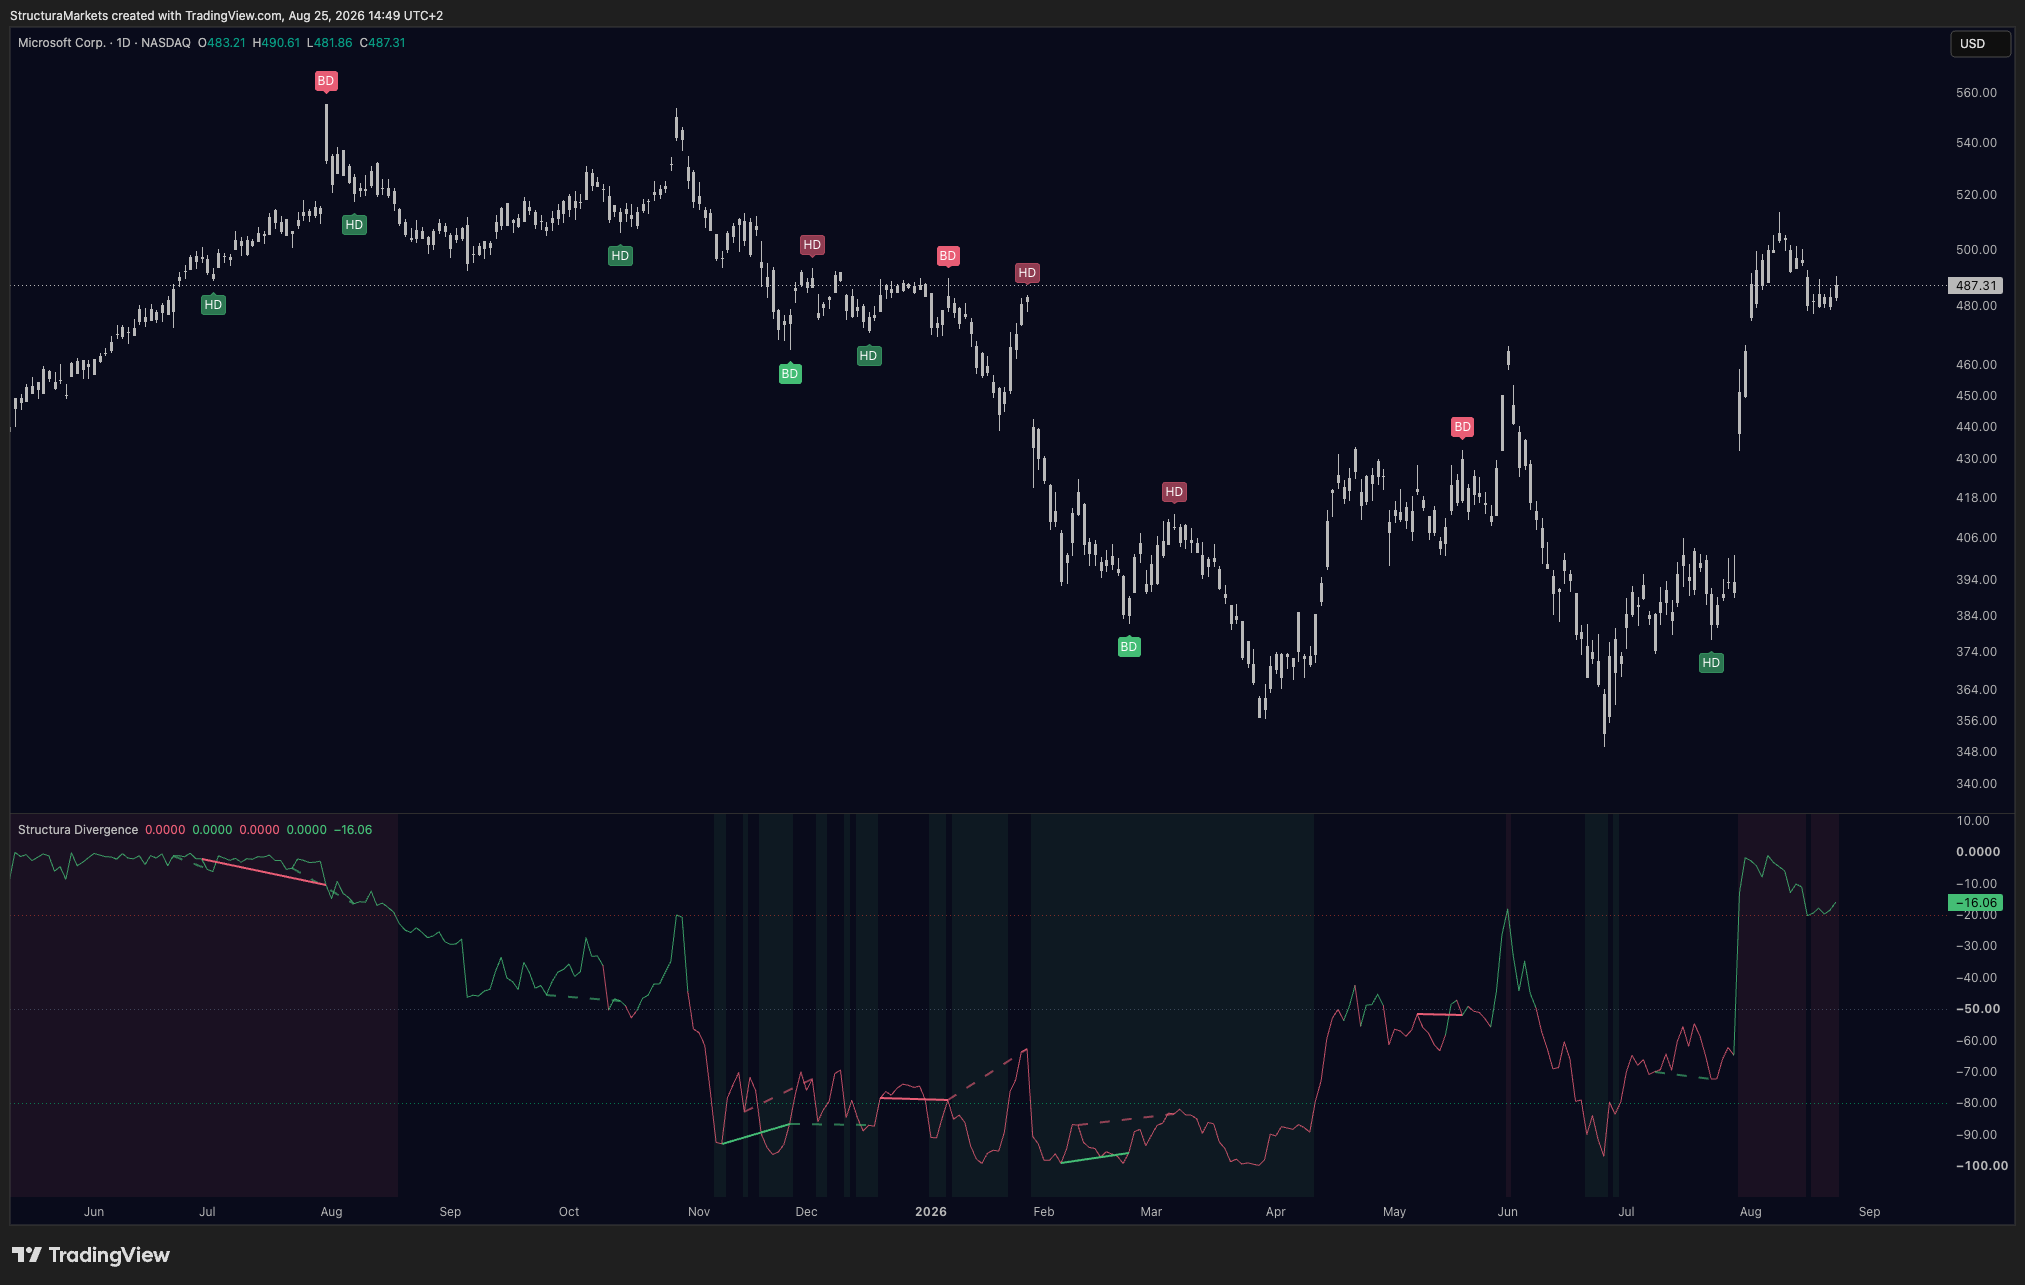
Divergence detects disagreements between price and momentum - moments when a new price extreme is not confirmed by the engine underneath it. It marks two families, regular and hidden, and it anchors every detection to confirmed pivots only: a pivot must be fully formed, with closed bars on both sides, before anything is drawn. Momentum is measured against a volume-weighted baseline, which makes the reading participation-aware rather than price-only.
Divergence is free but invite-only: one signup on the free tools page with your TradingView username, and access lands on your account within 24 hours. The script page is on TradingView; the reading rules are in the manual, and the concept is explained in our divergence article.
Built-in alternative: RSI with divergence enabled
The built-in RSI has a "calculate divergence" option. Turn it on and it labels regular divergences between RSI and price on confirmed pivots, with a delay. It reads one oscillator against price and nothing about participation, and it does not mark hidden divergences. For a first look at whether price and momentum disagree, it is free on every plan and it does not move its labels afterwards.
Volume and participation: what the built-ins cover
We have no free tool here, and the built-ins are strong. Volume is on every chart. Volume Profile reads where volume accumulated by price rather than by time, a structural question in its own right; availability of some profile variants depends on your plan. Cumulative Volume Delta reads the running difference between buying and selling volume. None of them reads structure; all of them say whether a move had participation, which is the question Divergence asks from the other side.
Trend, volatility and sessions: what the built-ins cover
For trend, the built-in EMA and SuperTrend give you a direction filter; for volatility, ATR and Bollinger Bands; for time, the Sessions indicator and Session Volume Profile. All of them draw on every bar, so none of them is ever silent - and that is the trade-off: a tool that always has an opinion cannot tell you when it has nothing to say. Our paid layers - Horizon, Pulse and Squeeze - read momentum, trend behaviour and compression as phases; they are in the plans, not on this page.
What is the best free indicator on TradingView?
It depends on the question, which is why this page is sorted by question rather than by rank. "Where is the market rebuilding": Accumulate. "Where did price leave gaps": Blocks. "Is this move supported": Divergence, or the built-in RSI with divergence on. "Did this move have volume": the built-ins. A single best indicator would have to answer all four, and a tool that answers everything is usually a tool that repaints.
What none of these indicators will do
None of them predicts. None of them tells you that a zone holds, that a gap fills, or that a divergence resolves one way. None of them issues entries or exits. A chart with all three free layers on it still needs reading - and a screenshot of it is still pixels, not data, which is why we do not recommend feeding one to a chatbot and asking what to do. Paid suites that promise more than this are promising something an indicator cannot know.
How to add them to TradingView
Accumulate and Blocks: open the script page on TradingView, add it to your favourite indicators, and it appears under Favourites in the Indicators dialog on any chart. Divergence: sign up on the free tools page with your email and TradingView username; access lands on your account within 24 hours under Invite-only scripts. No card, no trial, no feature gates on any of the three.
Frequently asked questions
What is the best free indicator on TradingView for market structure?
There is no single one, because structure is several questions. Accumulate reads where the market is rebuilding, Blocks reads the gaps it left behind, and Divergence reads whether a move is supported by momentum. All three are free. The built-in Anchored VWAP, Gaps and RSI divergence cover neighbouring questions with less context.
Are these indicators really free, or free with locked features?
Free in full. Accumulate, Blocks and Divergence are the same scripts on every account, with no lite version and nothing unlocked by a plan. The paid layers are different tools, not upgrades of these.
Do Structura Accumulate, Blocks and Divergence repaint?
Divergence does not: it anchors to confirmed pivots with closed bars on both sides, and it never recalculates its history. Blocks draws a zone from a completed candle sequence and never deletes a zone once it is filled - it turns grey and stays. Accumulate is drawn on closed bars. What you see on a closed chart stays where it is.
Is there a free fair value gap indicator on TradingView?
Yes. Structura Blocks is public on TradingView and marks imbalance zones - the areas usually called fair value gaps - with their age and fill status. It will not tell you whether a gap gets filled.
Can I use these on the free TradingView plan?
Yes. All three run on the free plan, within TradingView's indicator-count limit for that plan.
Do I need an account or a card to get them?
Accumulate and Blocks need only a TradingView account. Divergence needs one signup with your email and TradingView username. No card, no trial, no renewal.
Free. No trial, no card. One signup with your TradingView username.
Structura provides analytical tools and educational market examples. It is not financial advice. Trading and investing involve risk, and historical results do not guarantee future outcomes.