
What a Divergence Actually Tells You - and What It Doesn't
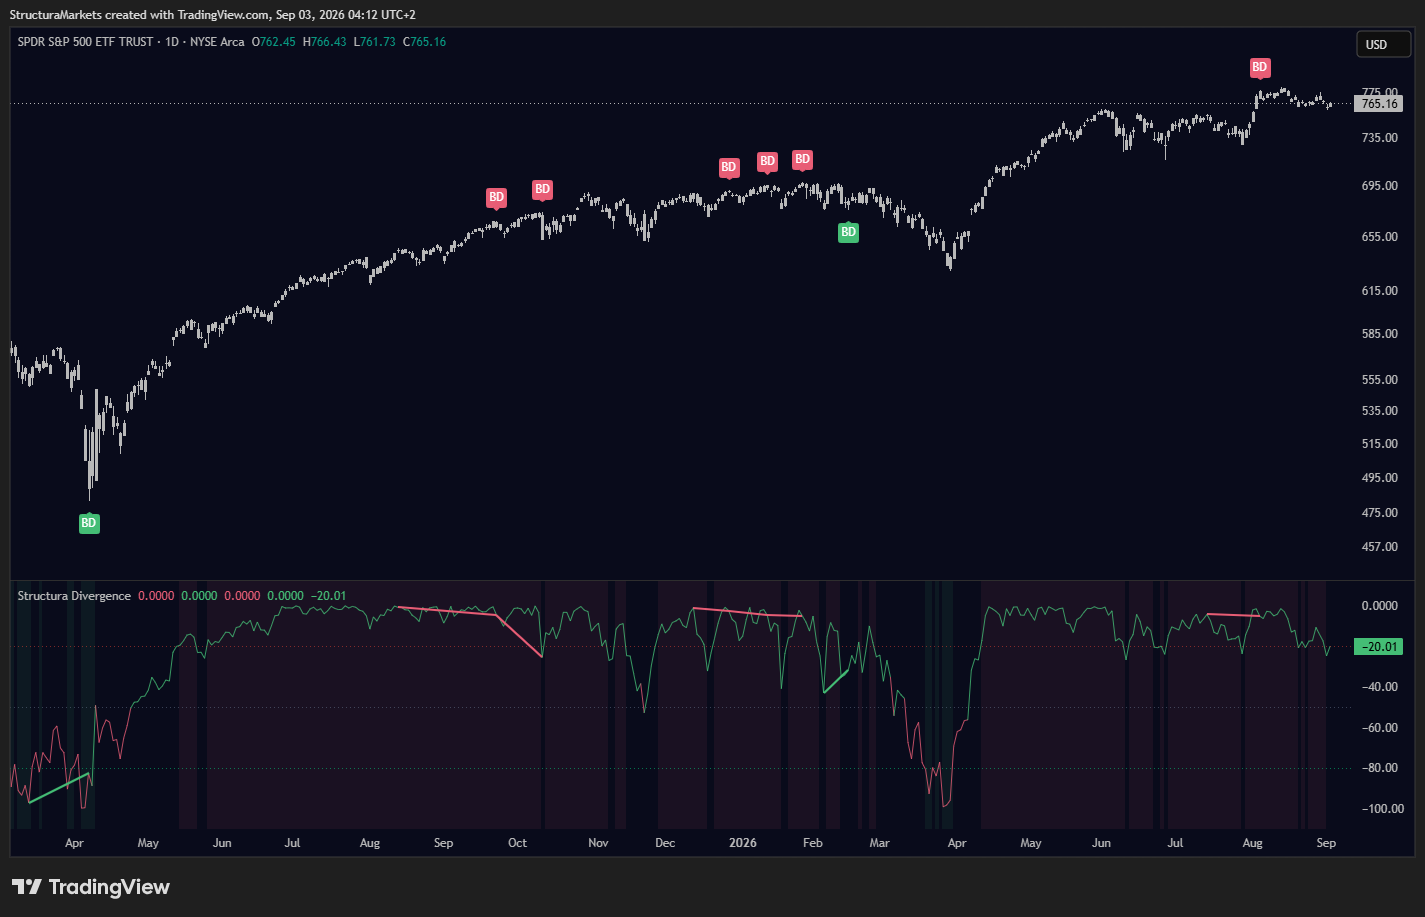
A divergence is a disagreement, not a signal. It happens when price makes a new extreme and the momentum underneath it does not agree - a higher high in price met by a lower high in momentum, or a lower low in price met by a higher low. That is the whole event. Most of what is written about divergence trading skips straight from the disagreement to a conclusion about what happens next. This article is about staying at the disagreement, because that is where the information actually lives.
What is a divergence in trading?
Price and momentum measure two different things, and a divergence is the moment they stop telling the same story. Price tells you where the market traded. Momentum tells you how forcefully it got there. Most of the time they move together: strong moves make new extremes with force behind them. A divergence is the exception - the market reaches further than before, but with less conviction underneath it than last time.
That gap between reach and conviction is worth noticing. It is not worth predicting from.
Regular and hidden divergence
Four shapes, one mechanism. The names are unhelpful jargon for something simple: whether the disagreement appears at a high or a low, and whether the momentum reading is falling behind or running ahead.
Regular bearish divergence - price prints a higher high, momentum prints a lower one. The move kept reaching, but stopped being confirmed from the inside.
Regular bullish divergence - price prints a lower low, momentum refuses to follow. The decline reached further, and the force behind it did not.
Hidden bearish divergence - a lower high in price while momentum stretches higher. The bounce spent more energy than it earned.
Hidden bullish divergence - a higher low in price while momentum dips lower. The pullback reset the momentum without breaking the structure of the larger move.
Regular divergences describe a move losing its backing. Hidden divergences describe a pause inside a move that is still intact. Both are descriptions of what has already happened.
What a divergence does not tell you
It does not tell you the trend is over. A market can print divergence after divergence and keep going - and it frequently does, because a market with less force behind it than last month is still a market going up. Momentum falling behind is a change in character, not a change in direction.
It does not tell you when. This is where most divergence trading goes wrong. Even in the cases where a divergence precedes a real turn, the gap between "the disagreement appeared" and "the market did something about it" can be a handful of bars or a full quarter. A signal without a timeframe is not a signal you can act on; it is context.
It does not tell you how far. Nothing about a lower momentum high implies the size of what follows.
And it does not become truer because it is on a bigger timeframe - only slower. A weekly divergence takes weeks to resolve, and it is wrong for weeks before it is right, if it ever is.
Why so many divergences "fail" - and why that word is wrong
A divergence that does not lead to a reversal has not failed. It was never a promise. It marked a disagreement; the market resolved that disagreement by continuing. That is one of the two ordinary outcomes, and it carries information: a market that reaches further without conviction, and then keeps going anyway, is telling you the crowd is not required to be enthusiastic for this to work.
The word "failure" only makes sense if the tool promised something. Ours does not - and neither should anyone else's. The honest framing is: the disagreement resolved in the direction that is less discussed on the internet.
This is also why survivorship makes divergence look better than it is. The examples that circulate are the ones that preceded a big turn. The ones that resolved by continuation get cropped out of the screenshot. If a method only shows you its good weeks, you are not looking at a method - you are looking at a highlight reel.
The honest protocol
A divergence is a hypothesis, and a hypothesis needs both outcomes written down before the market answers.
Confirmation is not the divergence itself. It is what the market does at the level that matters afterwards: the move stalls where the disagreement said conviction was thinning, participation confirms it, and the structure underneath gives way. Note the order - the divergence marks where to look; the confirmation happens later, somewhere else on the chart.
Invalidation is price continuing in the original direction with force restored. This is ordinary and frequent, and a reader who has written it down in advance loses nothing by it - they simply have their answer.
Write both down before the test. A divergence read after the move is a story; a divergence read before the resolution is a record. That difference is the entire discipline.
Timeframes, and the silence in between
Most of the time there is no divergence to read, and that is the normal state of a chart. Swing points that qualify take time to form, and by design they can only be confirmed after the fact - which means any honest divergence tool prints its marks with a delay, and prints nothing at all for long stretches. A tool that finds a divergence every day is not being sensitive; it is being loose.
The corollary matters: a mark that appears after confirmation should never move afterwards. If a tool redraws its own history as new bars arrive, you cannot check its record - and a record you cannot check is worth nothing, no matter how good the chart looks today.
Reading divergences with a structure layer
This is the protocol our own Structura Divergence is built around. It reads one specific disagreement - price making a new extreme that its own momentum does not confirm - and marks all four shapes: solid lines for regular divergence, dashed for hidden. Every mark is placed only after confirmation and stays exactly where it was drawn, including the ones the market later overrules. That is deliberate: the marks that were overruled are part of the record, and deleting them would make the chart prettier and the tool useless.
Divergence is free on TradingView; it sits alongside the other free structure tools in our comparison of free TradingView indicators for market structure.
It marks the disagreement. It does not resolve it - the market does that, in either direction, and both directions are information.
Divergence is free to use on TradingView. If you want to read disagreements on your own charts with the protocol from this article, it is the layer we built for exactly that.
Educational market commentary - not financial advice.
Read us first in your Google results:
Free on TradingView
Get the free structure layer.
Structura Accumulate marks where the market may be rebuilding structure before the move becomes obvious.