
Sunday Read #7 · The video version of this read is above; the text below covers the same chart, at reading speed.
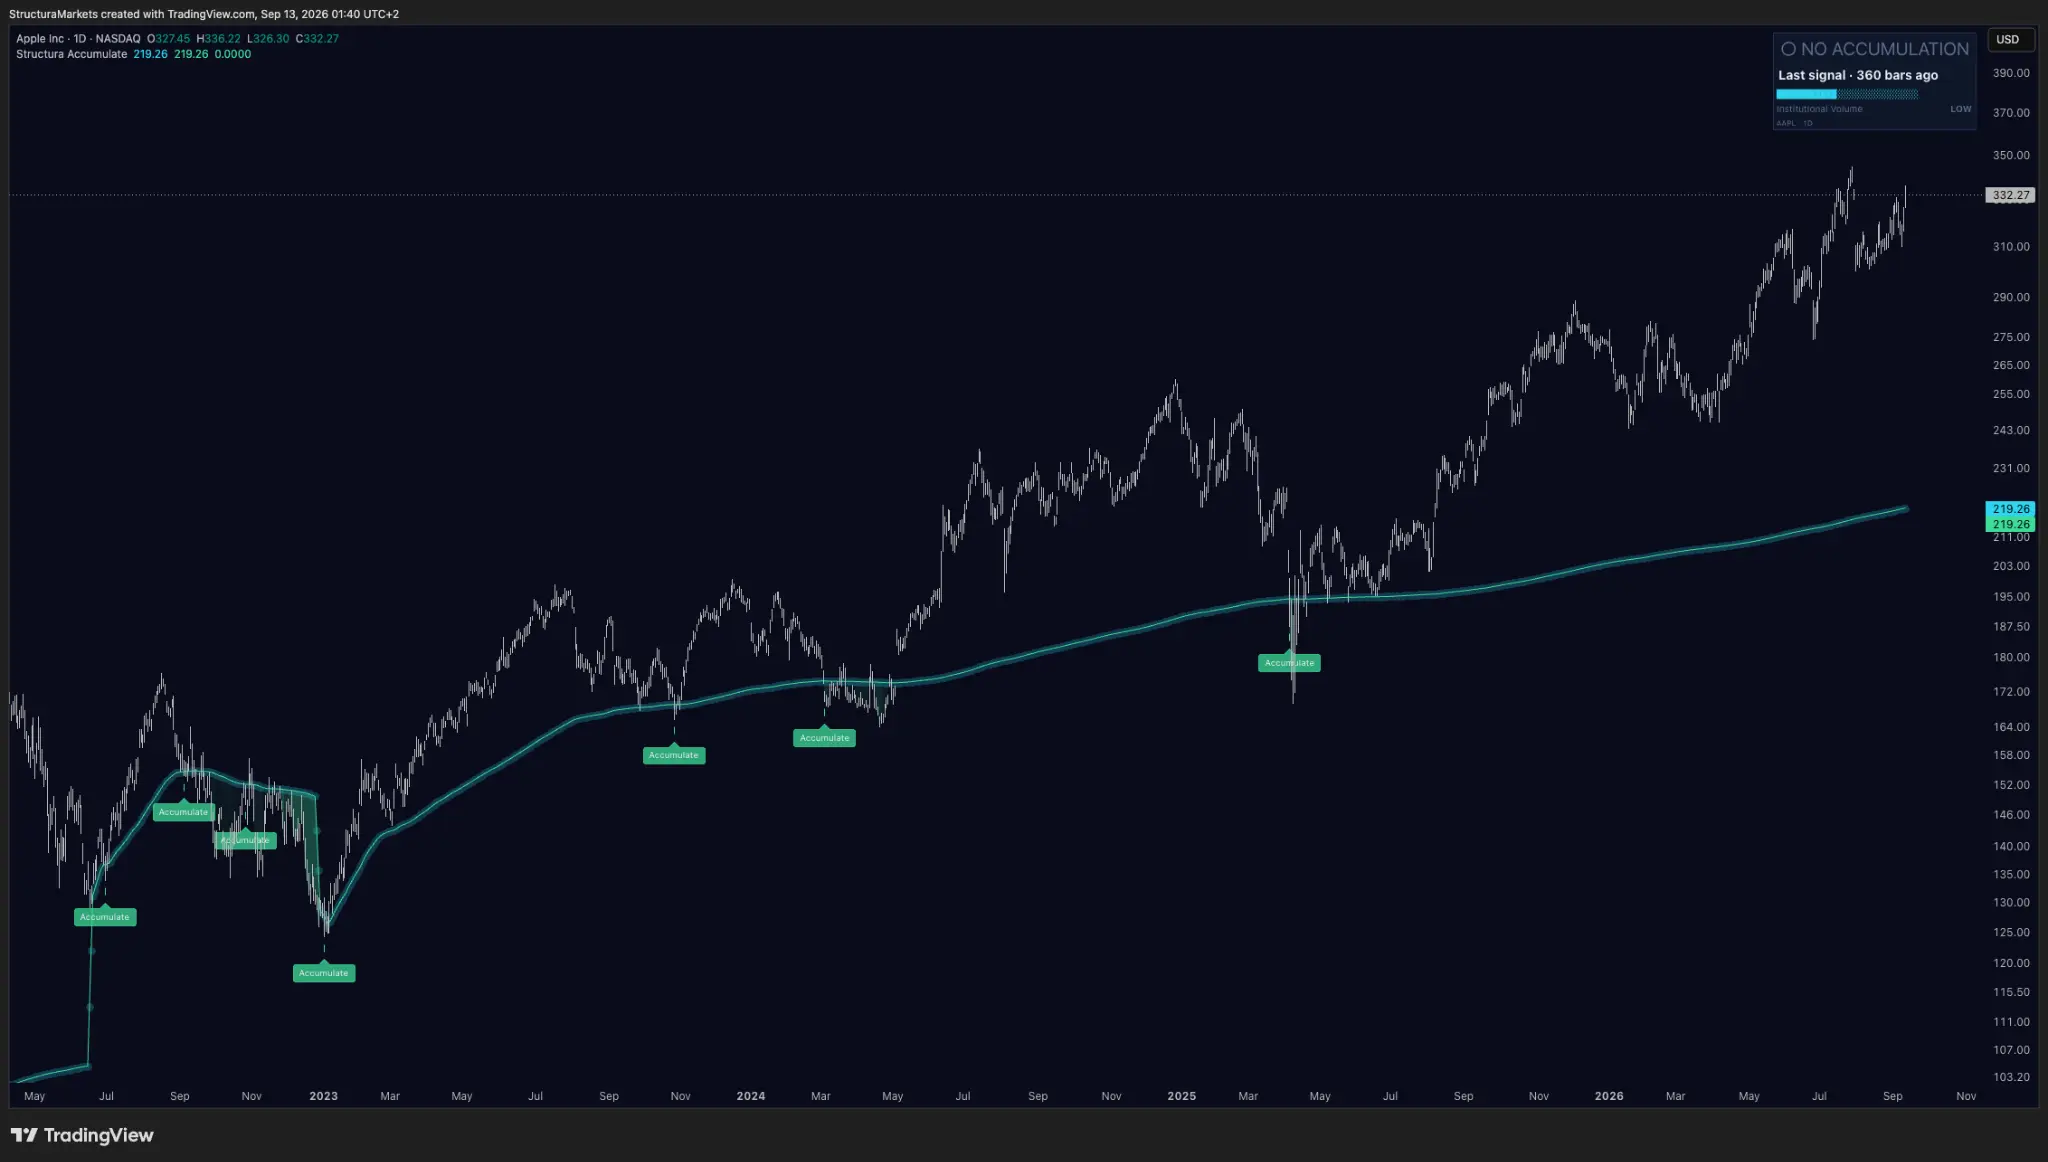
This is four years of Apple with every mark our accumulation layer has printed on it. There are seven. Four of them arrive in a cluster through the second half of 2022. Two more follow in 2023 and 2024. The last one printed in April of 2025.
Since that last mark, Apple has gone from roughly a hundred and ninety-three dollars to three hundred and thirty-two. Seventy percent. And this layer has said nothing at all for the entire move.
That is not a malfunction. It is the tool doing precisely what it claims to do, and it is the most useful thing about it.
A new question, second in the run
This is the second episode of one layer at a time - one tool each, and the same three questions asked of every one of them: what does this layer read, what does it refuse to say, and what does its silence sound like.
Last week: Divergence. Today: Accumulate, the other free one, and the one most people install first and misread fastest.
A zone, not a point
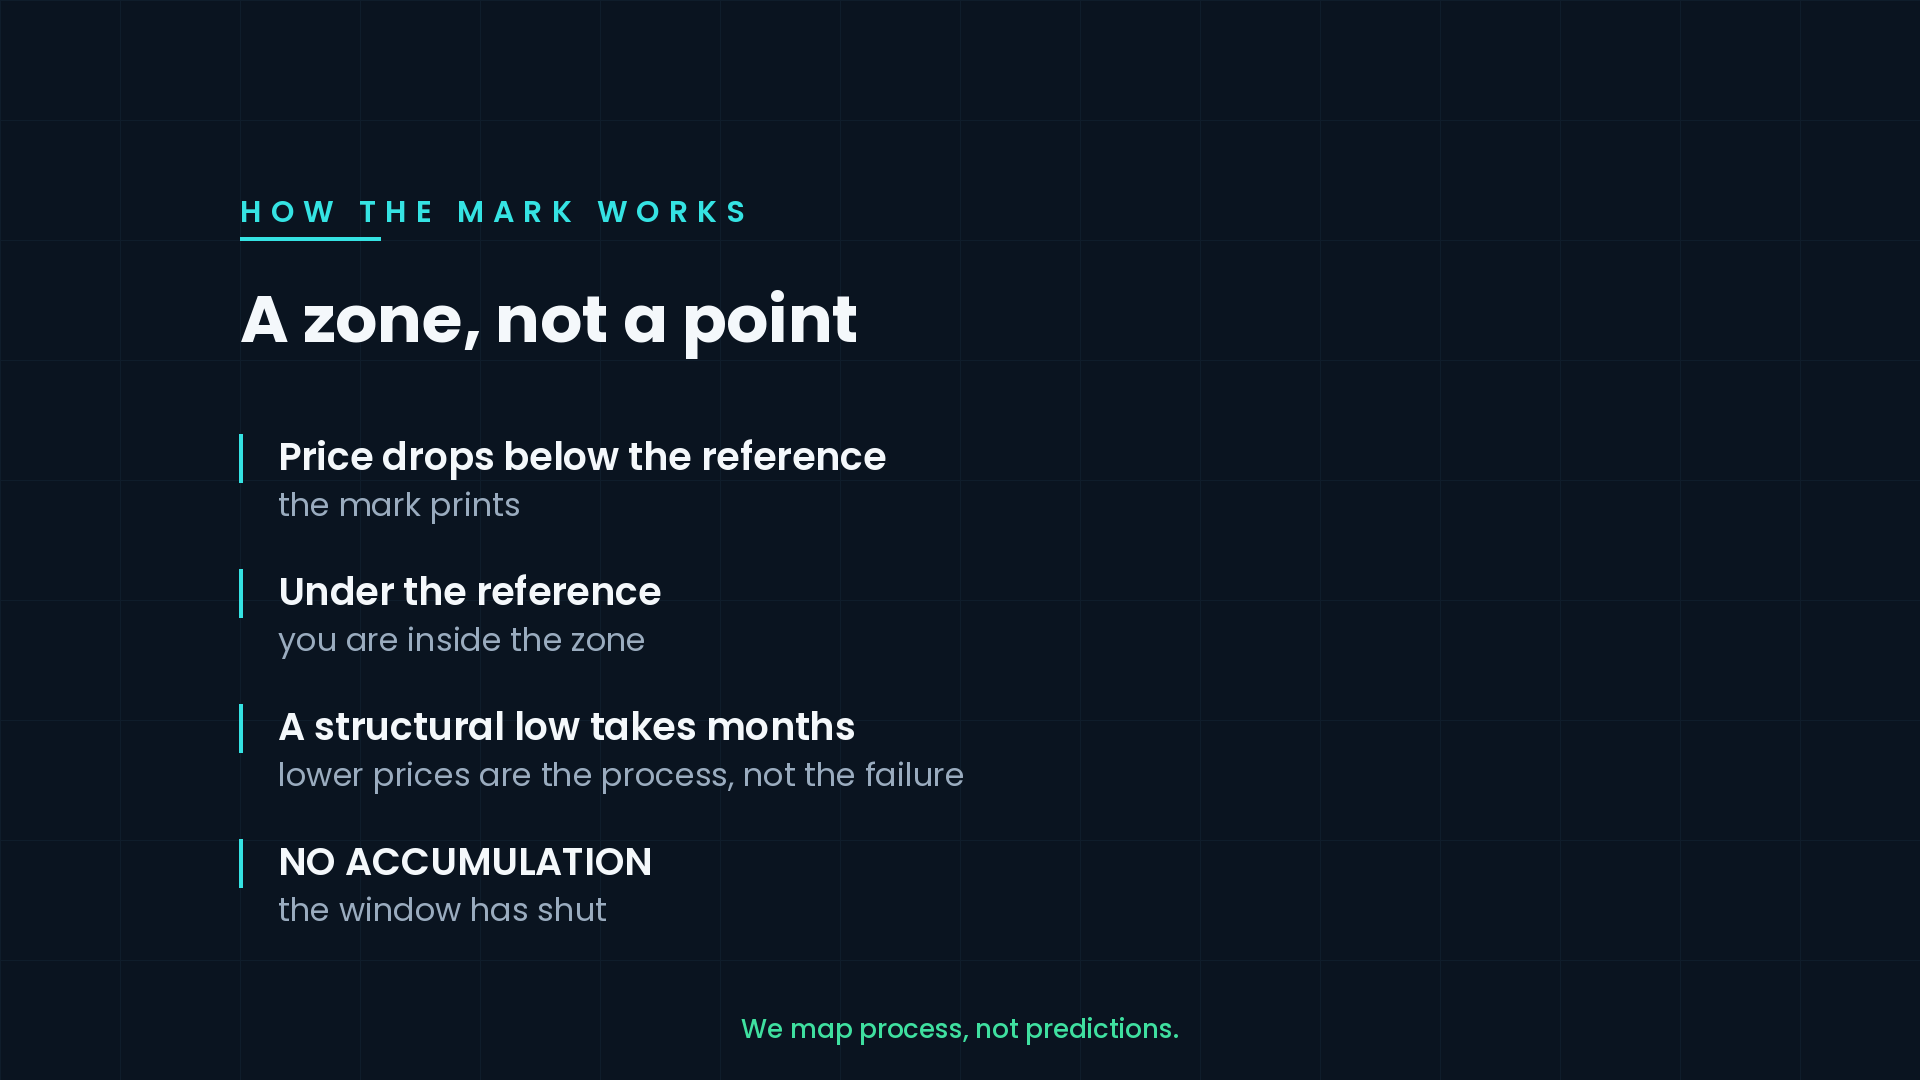
The mark prints when price drops below the layer's reference line. That is the entire event. It is the tool saying: you have entered an area where a structural low is being built.
Not that the low is in. Not that the falling has stopped. That you are now inside the part of the chart where accumulation happens - and accumulation, the thing the word actually describes, takes place over time, in pieces, carried out by people who expect to be early.
While price trades under that reference, the window is open. When the panel reads NO ACCUMULATION, the window has shut.
Now look at what that means in practice. The marks from September and October 2022 - around a hundred and fifty and a hundred and forty-three dollars - were followed by three more months of falling, down to a hundred and twenty-five.
Most tools would call that a failure. This one is built for it. A layer whose whole premise is that a structural low is being constructed has to survive the construction, and construction, on a chart, looks like lower prices arriving over months. If it only printed at the exact low it would not be describing accumulation at all. It would be calling a bottom, which is a different claim, and one no honest tool makes.
The mistake is not in the tool. The mistake is reading a window as a moment.
What it refuses to say
It does not tell you where the low is. Four marks in six months, at four different prices, and the lowest of them was not the low either. That is not the tool changing its mind four times; it is the tool describing one long process four times while the process was still running.
It does not tell you when. On this chart, roughly eight months separate the first mark from the move that justified it. On other charts it has been longer.
And it does not tell you how far. Nothing in a zone implies the size of what follows it. This one happened to be followed by a stock that more than doubled. Most are not.
There is a version of this article that shows you the first mark at a hundred and twenty-eight dollars, today's price at three hundred and thirty-two, and lets you do the arithmetic. That version would be a lie of omission. It would skip the three months of falling in between, and it would skip the four other marks that arrived at worse prices.
What its silence sounds like
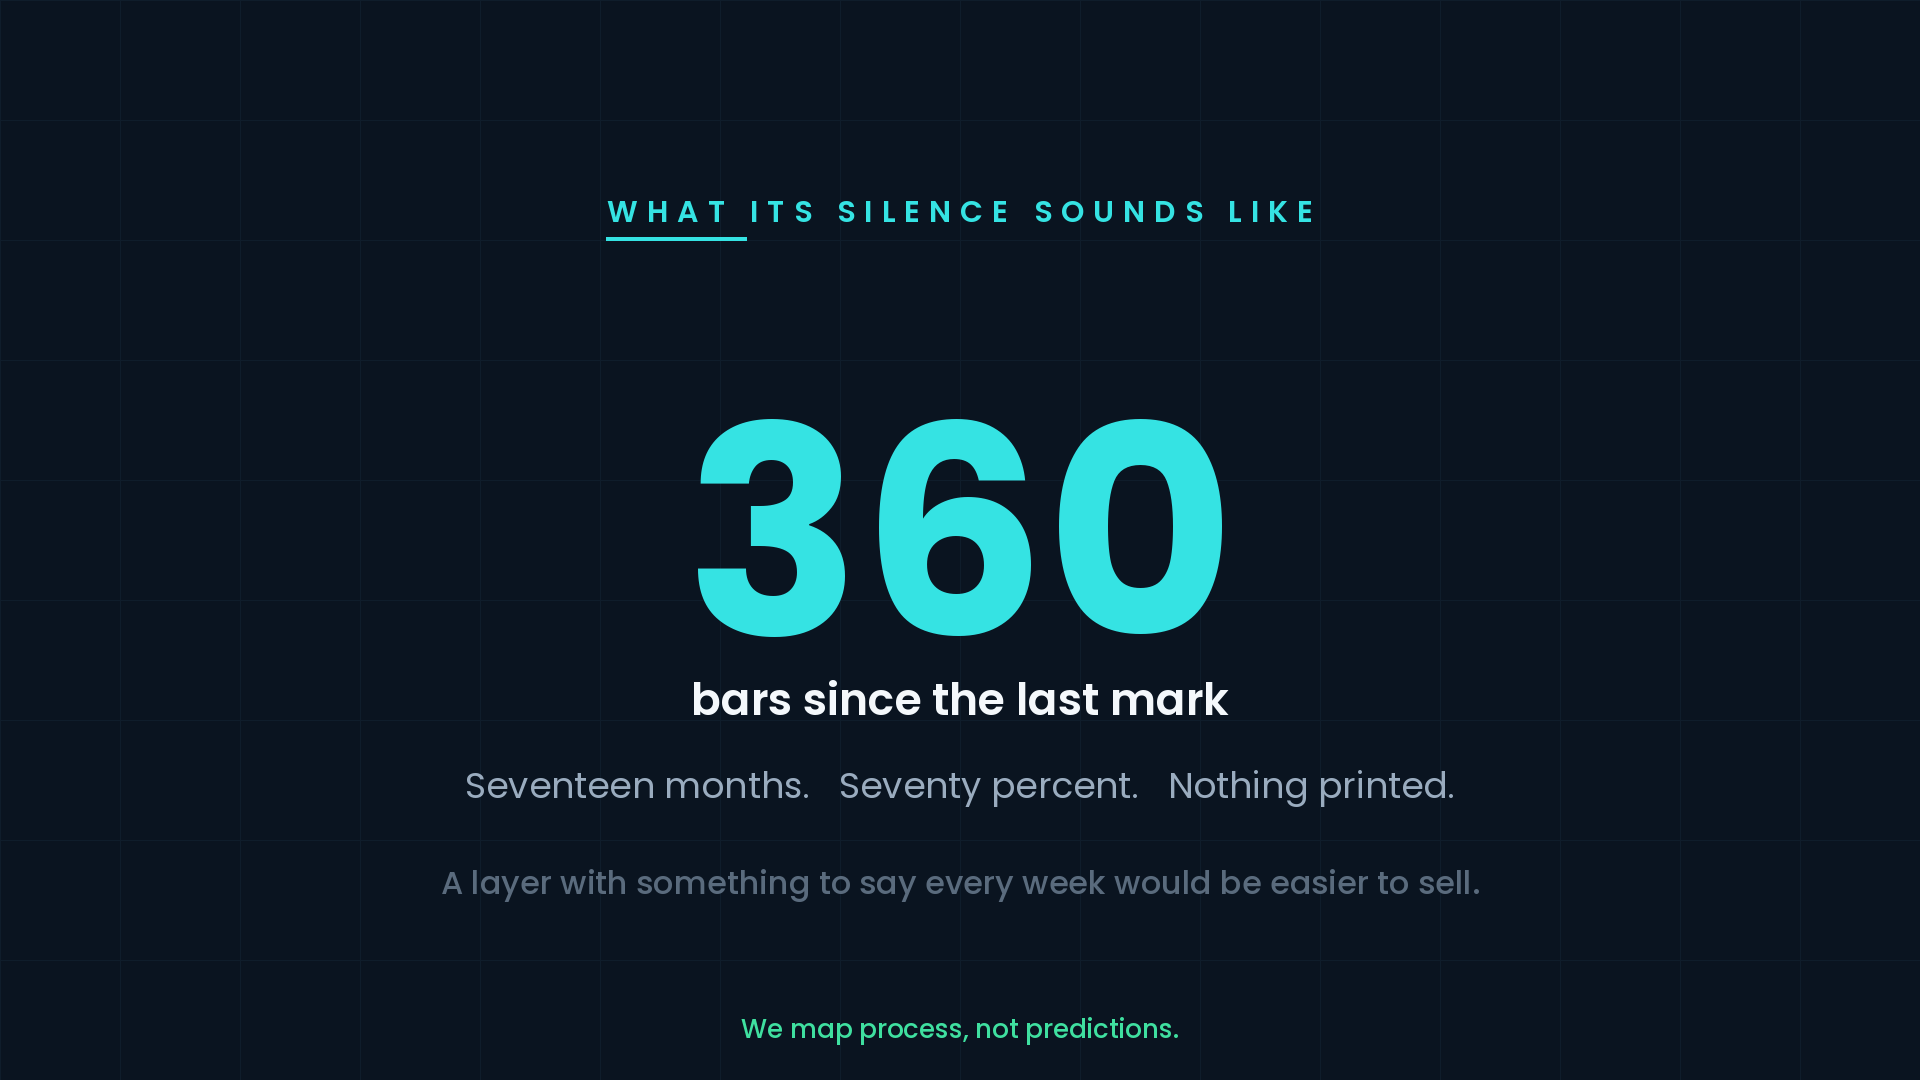
The counter reads three hundred and sixty bars since the last mark. Seventeen months. Through a seventy percent advance, this layer has printed nothing.
That is correct behaviour. Accumulate reads one condition, and a stock in the middle of a strong, well-owned advance is not in that condition. There is nothing there to mark, so nothing gets marked.
This is the point where most people delete the indicator. It sat quiet for a year and a half while the chart did something spectacular, and quiet feels like broken. A layer with something to say every week would be far easier to sell and worth considerably less. This one speaks perhaps once every few years per market. That is the honest rate, and pretending otherwise would mean loosening the condition until the marks stopped meaning anything.
And if you want to know what it thinks of Apple today: it has no opinion. NO ACCUMULATION is not bearish. It means the window is shut and the question this tool answers is not currently on the table.
Last Sunday's receipts
Two questions written down last week. Both have answers.
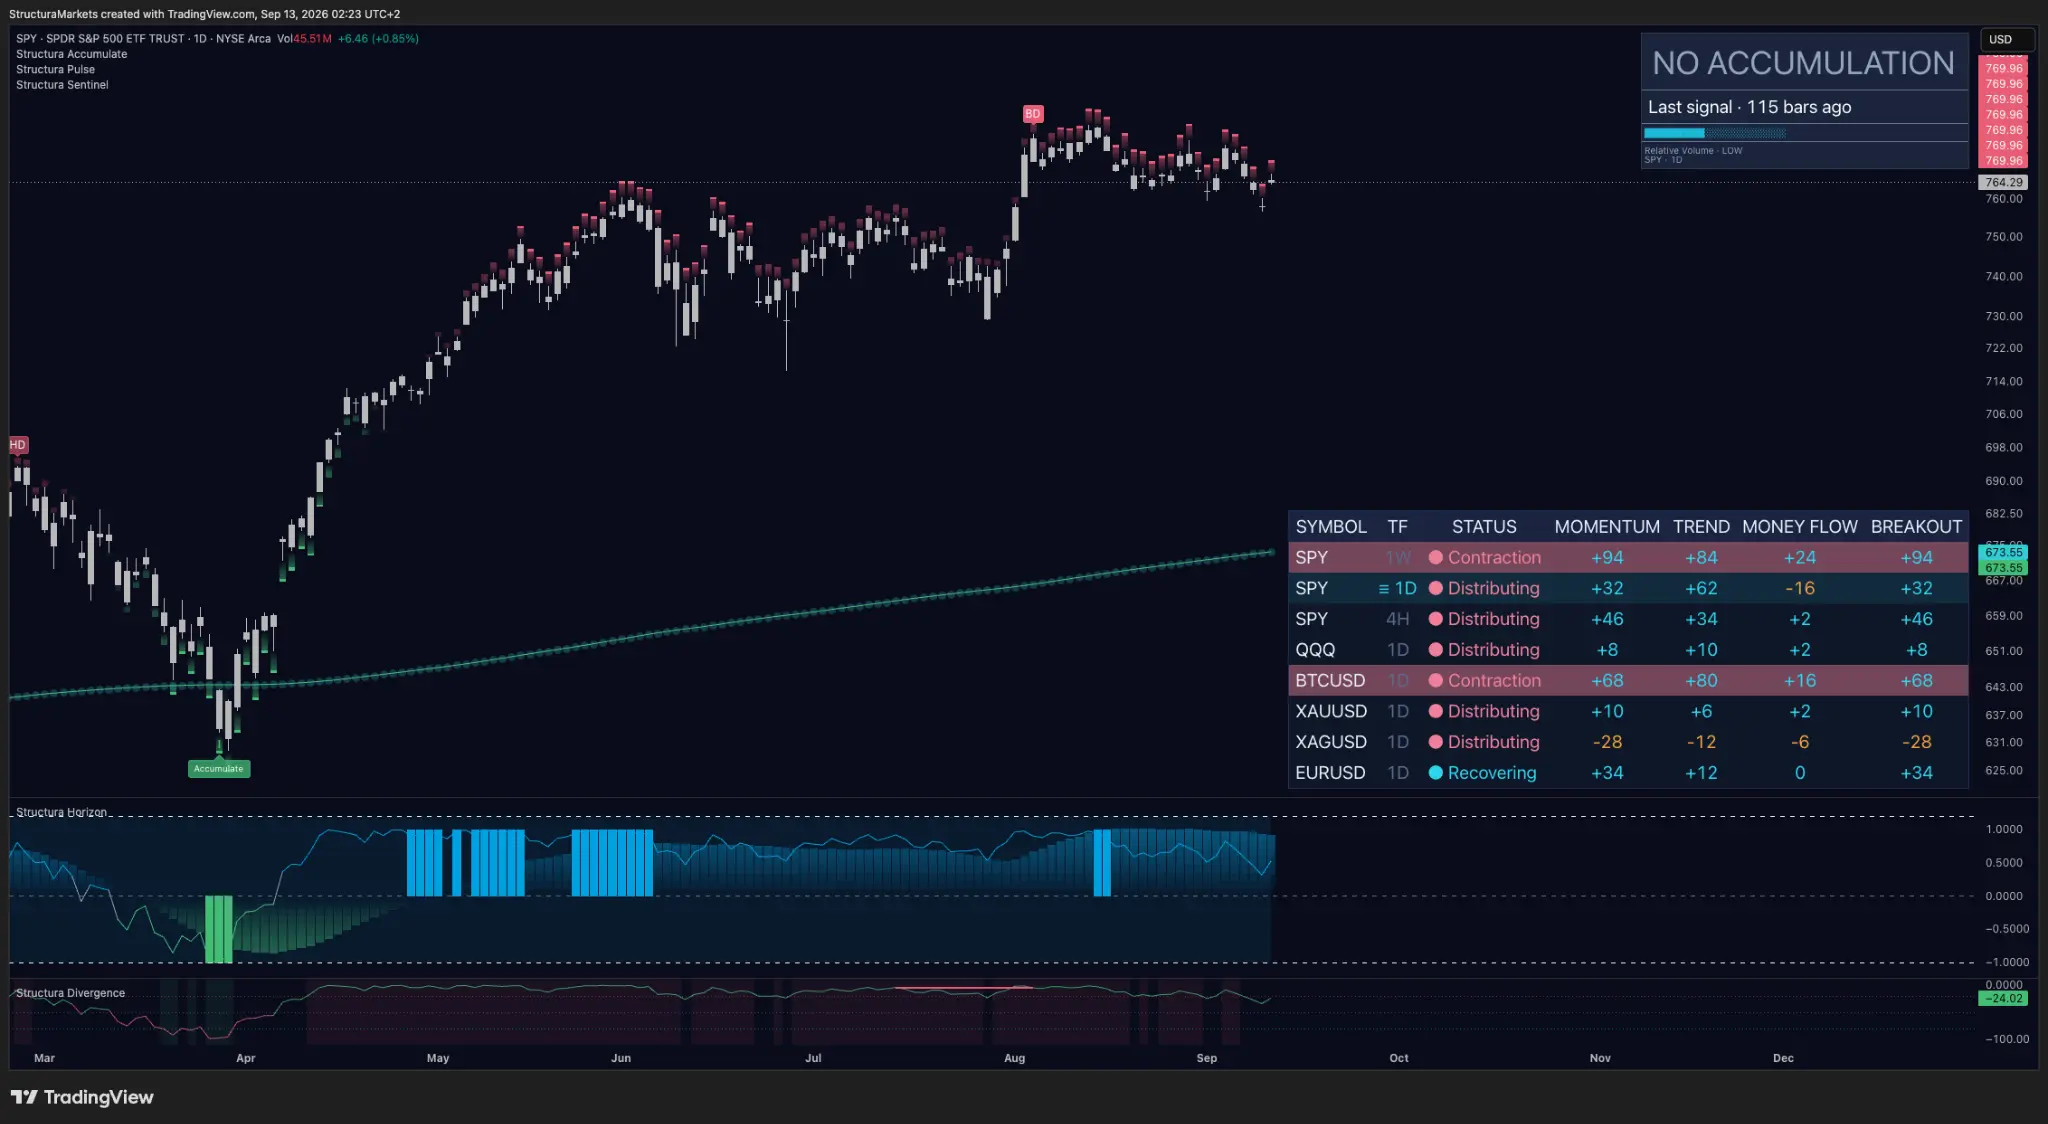
The index. We said momentum sat at plus eighty-two against money flow at minus eight - the widest gap on our board, widening for a fortnight - and asked which side would move.
It was price. Momentum has come down from plus eighty-two to plus thirty-two. Money flow did not improve; it went further negative, from minus eight to minus sixteen. The gap closed by half and it closed entirely from the price side. Participation never arrived. If you want the long version of why the gap between momentum and money flow is the part worth watching, rather than either number on its own, we wrote it out this week.
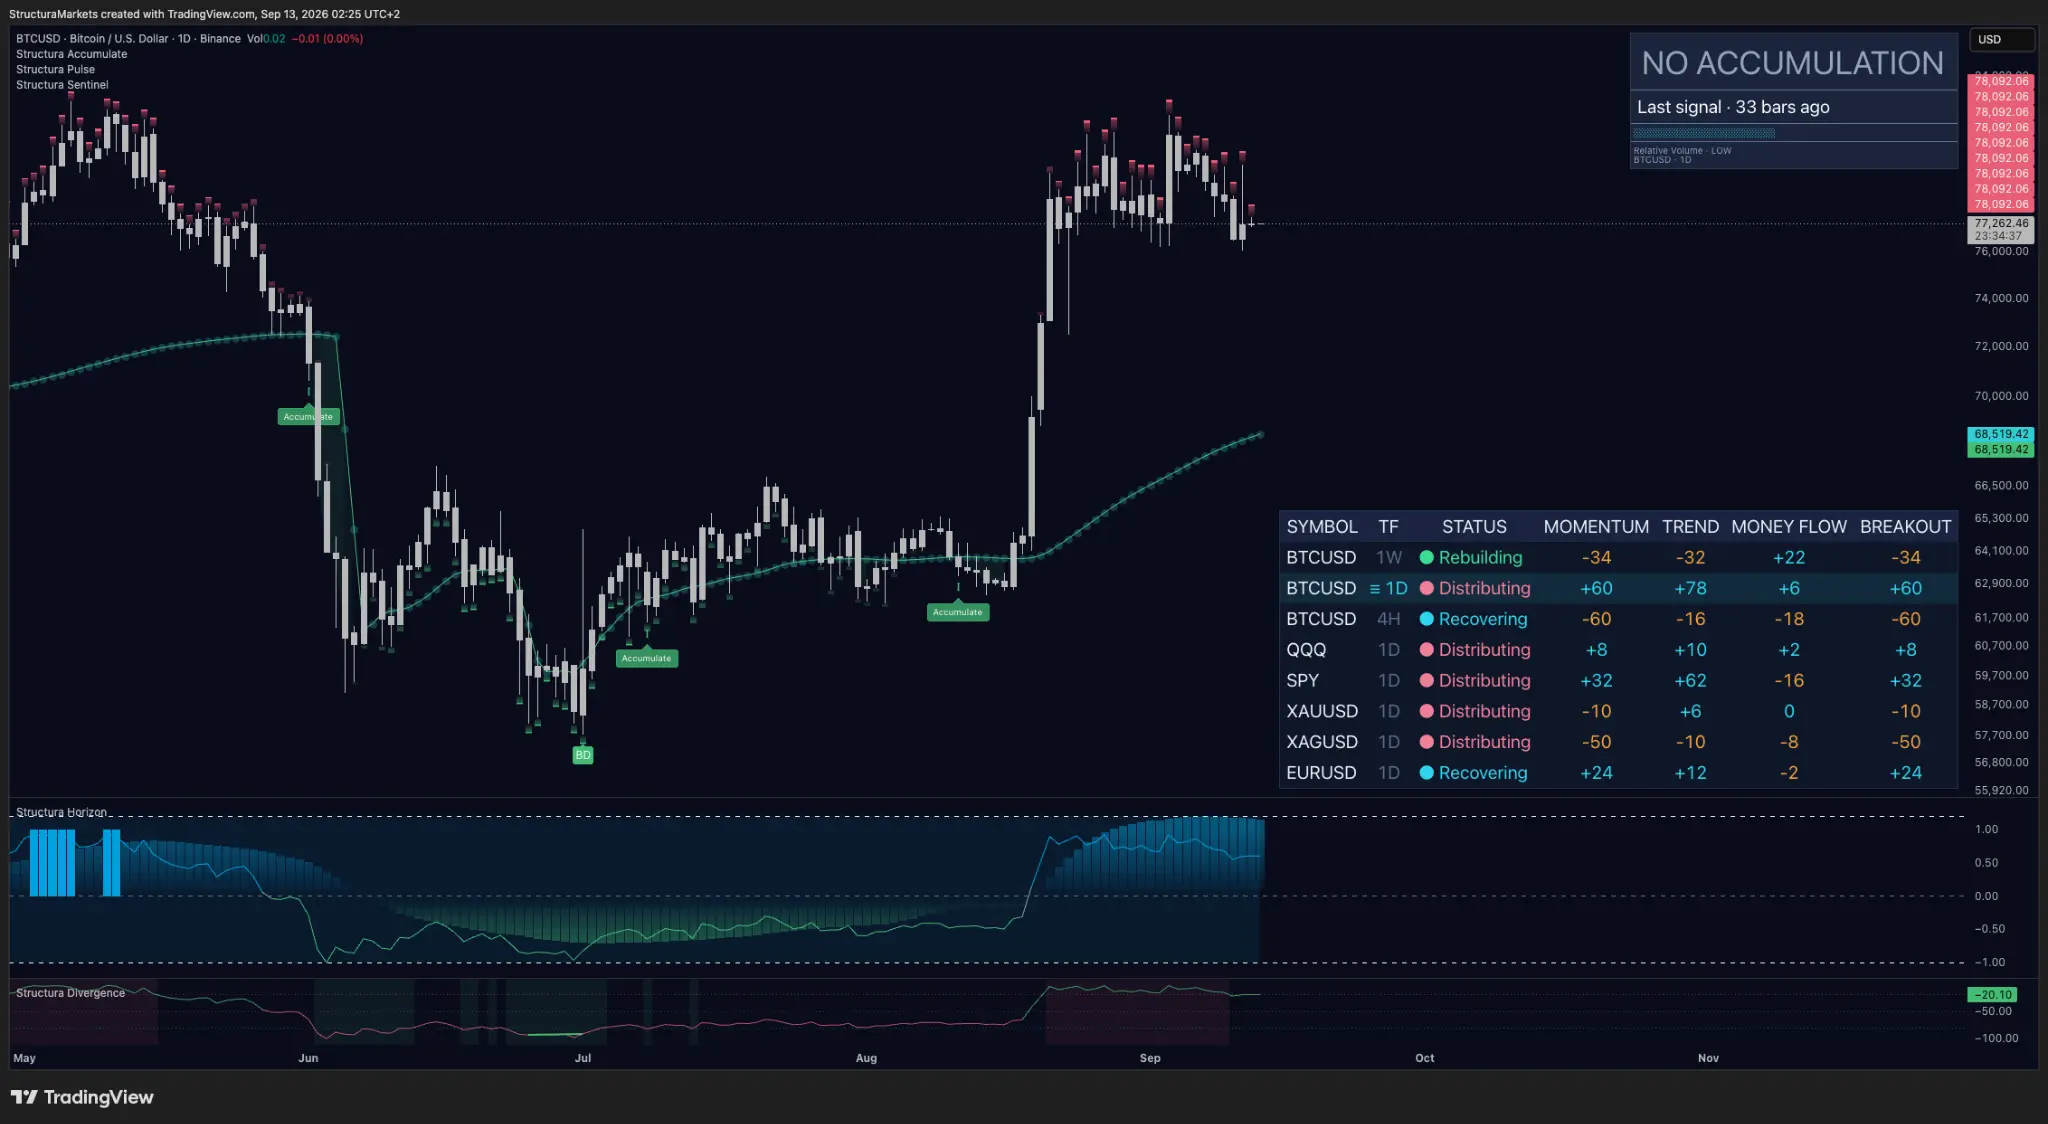
Bitcoin. We said the label read Contraction - compression - while its row carried the strongest money flow we track, and that which gave first was this Sunday's answer, not last Sunday's guess.
Compression gave first, and it gave upward. Through the second half of August bitcoin broke out of that range and it has held the higher ground since. The label now reads Distributing with momentum in the high fifties. The funding was describing something real - and note what we did not do a week ago, which was tell you so. We wrote the tension down and waited.
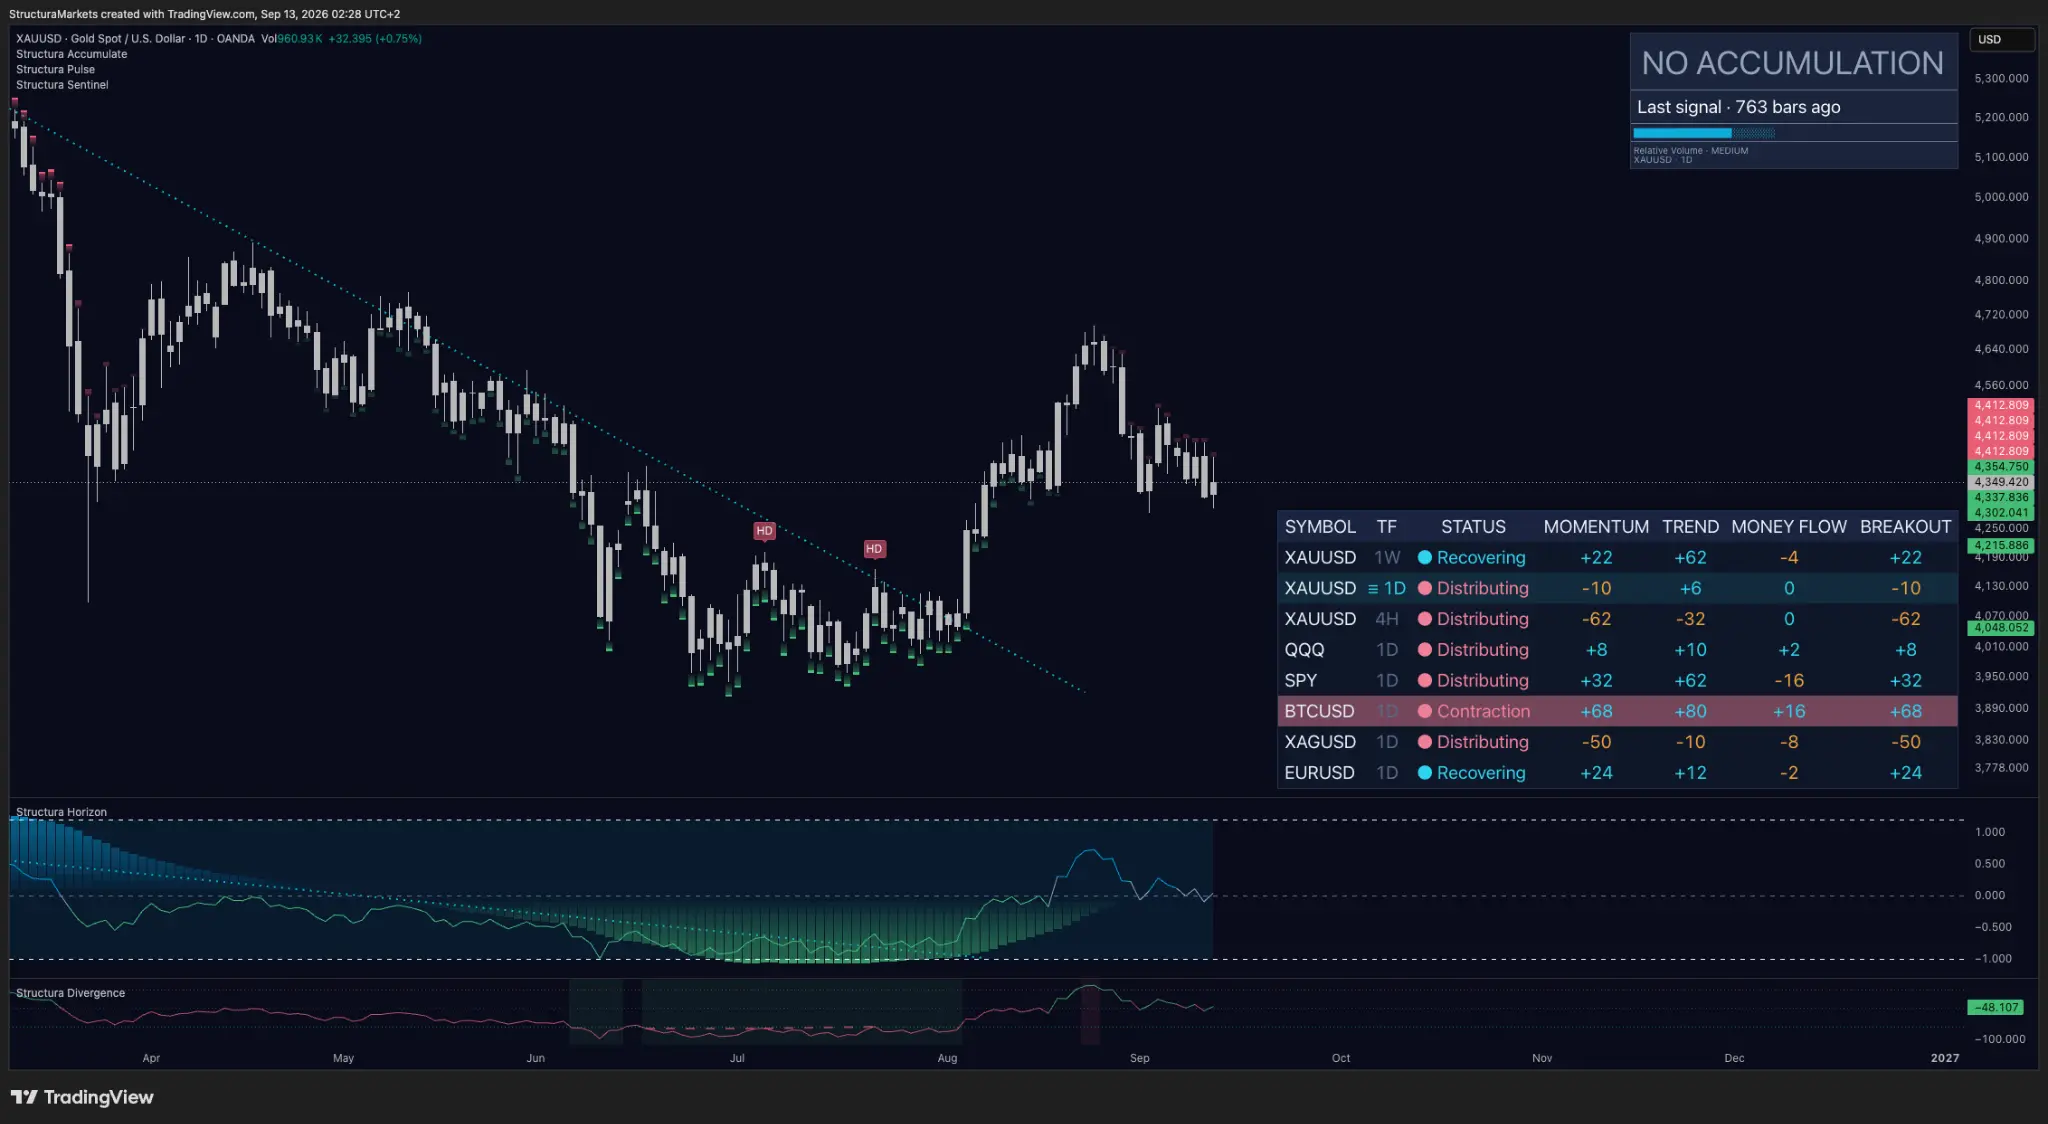
Gold, one week on. Two Sundays ago we called it passed, with the reason it mattered removed: the level held while relative volume slid to low. That volume reading has come back to medium and the weekly row has turned to Recovering. The daily is still Distributing. Half of what was lost has come back; the read is not finished.
Into the week
Silver. Minus fifty on momentum, minus ten on trend, minus eight on flow - the weakest row on our board and the only one where all three point the same way. When every column agrees there is no disagreement to read, and that is information of its own: this is not a market in conflict, it is a market being sold.
Gold against silver. Gold's weekly reads Recovering; silver's daily is the worst reading we have. Two metals that usually tell one story are keeping different clocks this week. Which one is early is next Sunday's answer.
Educational market commentary - not financial advice.
Read us first in your Google results:
Free on TradingView
Get the free structure layer.
Structura Accumulate marks where the market may be rebuilding structure before the move becomes obvious.
Get the free structure layer