
Search this question and you will find a confident answer: money flow leads price. Volume gets in first, the story goes, and price follows a step behind — so if you watch the flow, you see the move before it happens.
It is a good story. It is also backwards, and it is easy to show why.
What money flow is built from
Every money-flow measure in common use is calculated from price and volume. Not from order books, not from institutional filings, not from anything hidden — from the same candles you are already looking at, weighted by how much traded.
That has a consequence people skip past: a number built from price cannot lead price. It is downstream by construction. When price rises on heavy volume, money flow rises. When price falls on heavy volume, money flow falls. The line moves after the bar closes, because the bar is its input.
So when someone shows you a chart where money flow "turned first", look at what actually happened. Either the turn is visible in price too and it was read generously after the fact, or it is one of the many turns that led nowhere and did not make it into the screenshot.
Then why watch it at all?
Because "it follows price" and "it is useless" are different statements, and only the first one is true.
Money flow tells you something price alone does not: how much participation was behind the move. Two markets can be up the same four percent this month. In one, the buying was broad and heavy. In the other, price drifted up on thin volume while the size sat out. Price says the same thing about both. Money flow does not.
That is a description of the present, not a forecast. And a description of the present is worth having, because most bad reads come from not knowing what you are actually looking at.
The information is in the gap, not the level
Here is the part that took us a while to get right, and that we corrected in our own material after publishing it wrong.
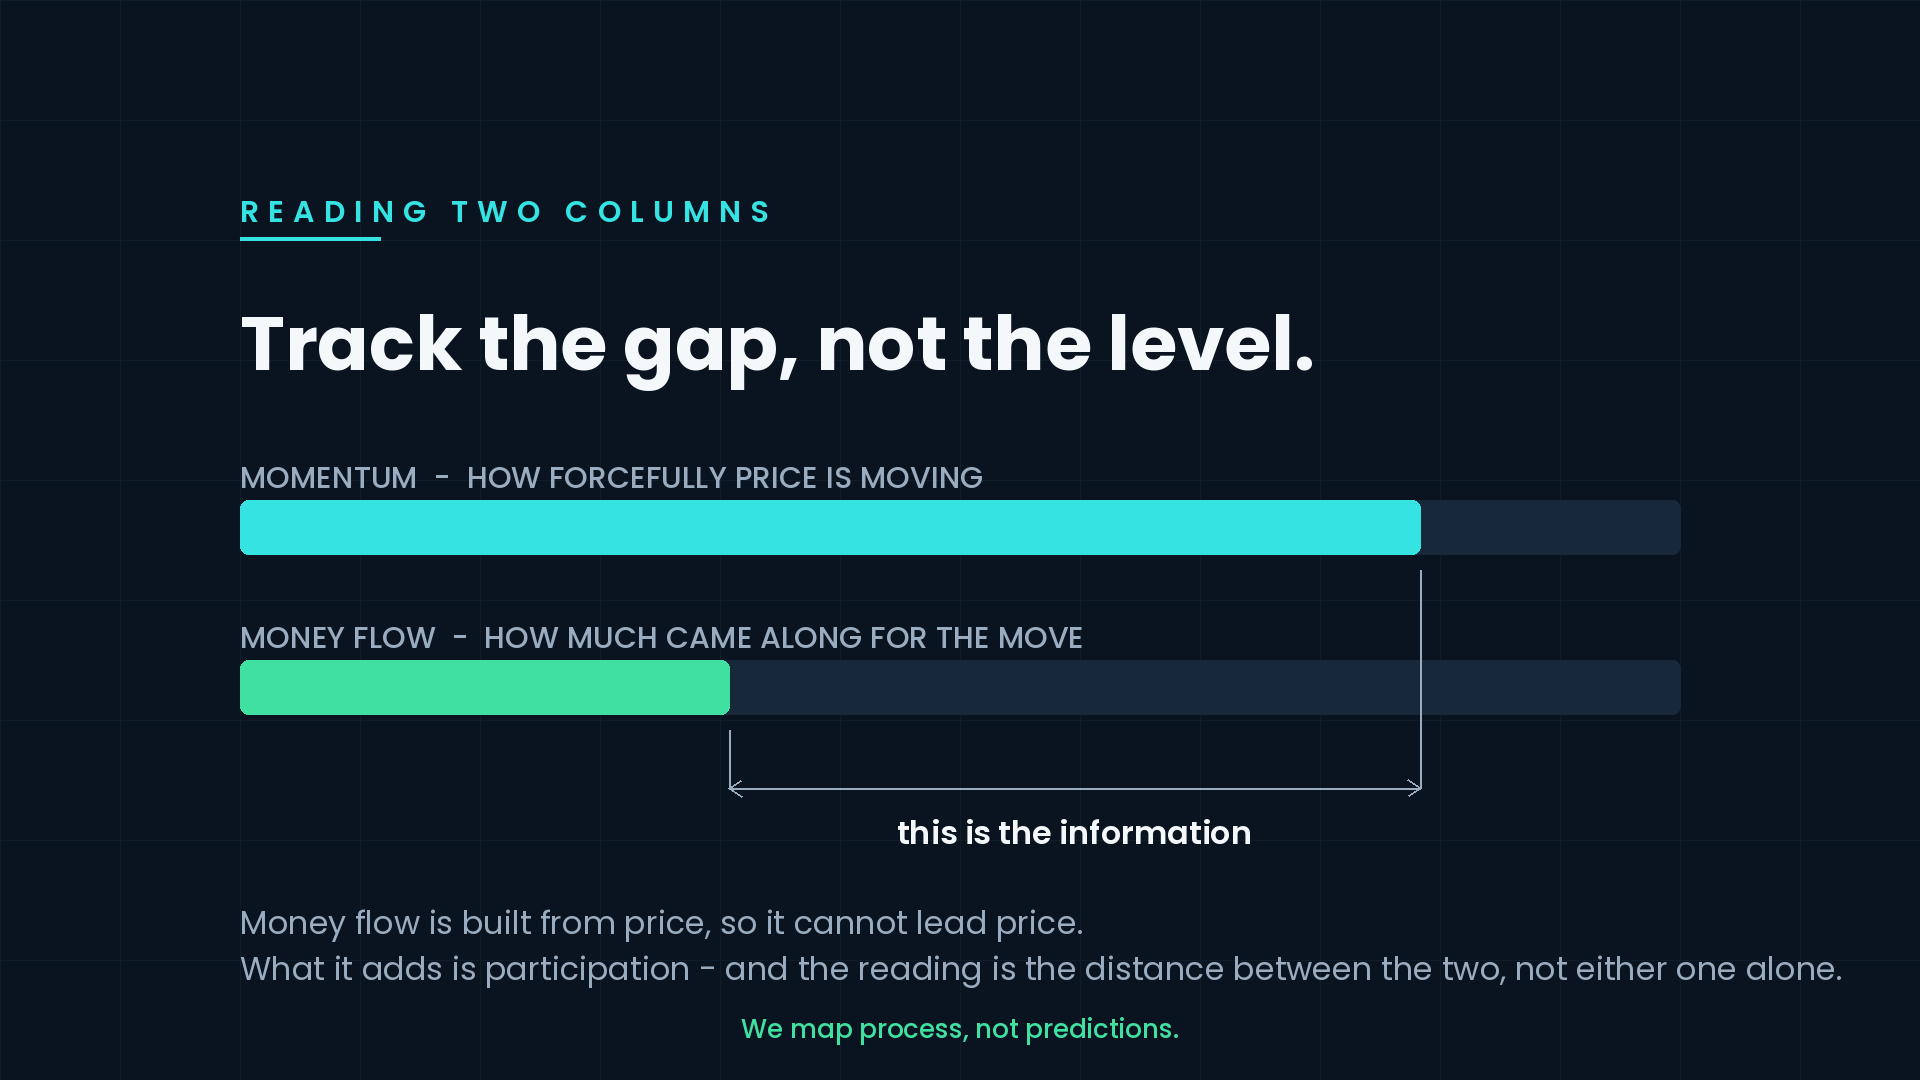
A money-flow reading on its own — strong, weak, positive, negative — tells you very little, because it moves with price and price is already on your screen. What tells you something is the distance between money flow and momentum: how forcefully the market is moving, set against how much participation is behind that move.
When the two agree, there is nothing to see. Price is rising, force is rising, participation is rising, everything says the same thing.
When they disagree, you have a fact worth writing down. Momentum stretched to an extreme while money flow sagged means the move got faster without getting broader. Money flow building while momentum stays flat means participation is accumulating under a market that is not going anywhere yet.
Neither of those is a signal, and we would not call them one. They are a change of character — the same category as a disagreement between price and its own momentum, read one layer up.
Track the gap, not the level. If you take one thing from this page, that is it.
What it looks like in practice
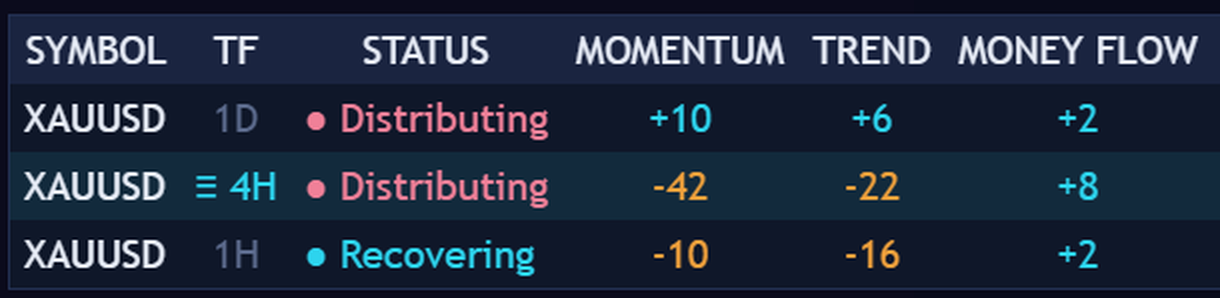
On our table, momentum and money flow sit on the same row for exactly this reason: the useful reading is horizontal, not vertical.
Above is gold, read on three clocks at the same moment. Money flow is positive on all three — mildly on the daily and the hourly, a little more on the four-hour. Momentum says something different on each: modestly positive on the daily, deeply negative on the four-hour, negative and lifting on the hourly.
The four-hour row is the one worth writing down. Fifty points separate how forcefully that market is moving from how much participation is behind the move — force pushing hard in one direction while the flow underneath leans the other way. That is not a contradiction in the data. It is a market where the selling has force but has not taken the participation with it.
Read the level alone and you would see three positive money-flow readings and conclude that gold is being accumulated on every timeframe. Read the gap and you get something more careful: on the daily the two agree and there is nothing to see; on the four-hour they have stopped describing the same market.
That gap can close two directions — participation comes to meet the price, or price comes back to meet the participation — and nothing in the reading tells you which. What it tells you is where to slow down.
The gap also has a life. A one-day divergence between the columns is noise. The same gap widening for three weeks is a condition. Duration is doing more work here than magnitude, which is why we watch the same rows week after week rather than scanning for extremes — one layer at a time, each answering one question.
What money flow will not tell you
It will not tell you where price is going. It is downstream of price; asking it for direction is asking an echo which way the shout came from.
It will not tell you who is buying. "Institutional money flow" is a marketing phrase. A volume-weighted price calculation cannot distinguish a pension fund from a retail account from a market maker's hedge. Anyone selling you a picture of what the smart money is doing, built from public candles, is selling you a picture.
It will not tell you when. A gap between participation and price can persist for a very long time. Markets are allowed to keep rising on thinning volume, and they often do — sometimes for months.
The honest version
Money flow does not lead price. It follows it, and it measures something price does not: how much of the market came along for the move.
Read on its own, it will mostly repeat what your chart already said. Read against momentum, it will occasionally tell you that the market's force and the market's participation have stopped agreeing — and that is a fact worth having, precisely because it is not a prediction.
Structura reads market structure one layer at a time — momentum, participation, phase and trend, each answering one question and staying quiet when it has nothing to say. See the free tools →
Educational market commentary — not financial advice.
Read us first in your Google results:
Free on TradingView
Get the free structure layer.
Structura Accumulate marks where the market may be rebuilding structure before the move becomes obvious.
See the free tools