
Accumulation vs Distribution: How to Tell Them Apart on a Chart
Accumulation and distribution are the two phases where the market changes hands. One builds a base under a future rise; the other builds a ceiling over a future decline. The trouble is that while they are happening, they look almost identical: a range, a lot of overlapping candles, and a lot of people losing patience. The difference shows up afterwards, which is exactly when it stops being useful.
So the question is not "is this accumulation or distribution?" - you will find out. The question is: what can you read while the range is still open? Four things, in our experience, and none of them is the news.
Why they look the same
Both phases exist for the same reason. A large participant cannot buy or sell a meaningful position in one session without moving the price against themselves. So they do it slowly, inside a range, absorbing what the other side offers. From the outside, that patience looks like nothing is happening.
That is the first thing to accept: a boring range is the signature of both. If you need the chart to be exciting before you read it, you will only ever see these phases in hindsight. The Wyckoff method built an entire vocabulary around this - springs, upthrusts, tests - and most of it is a way of describing what absorption looks like from the outside.
1. Where the range sits
The first tell is context, and it is the one people skip. Accumulation builds after a decline, at a place where selling has been going on long enough to exhaust itself. Distribution builds after an advance, where buying has done the same.
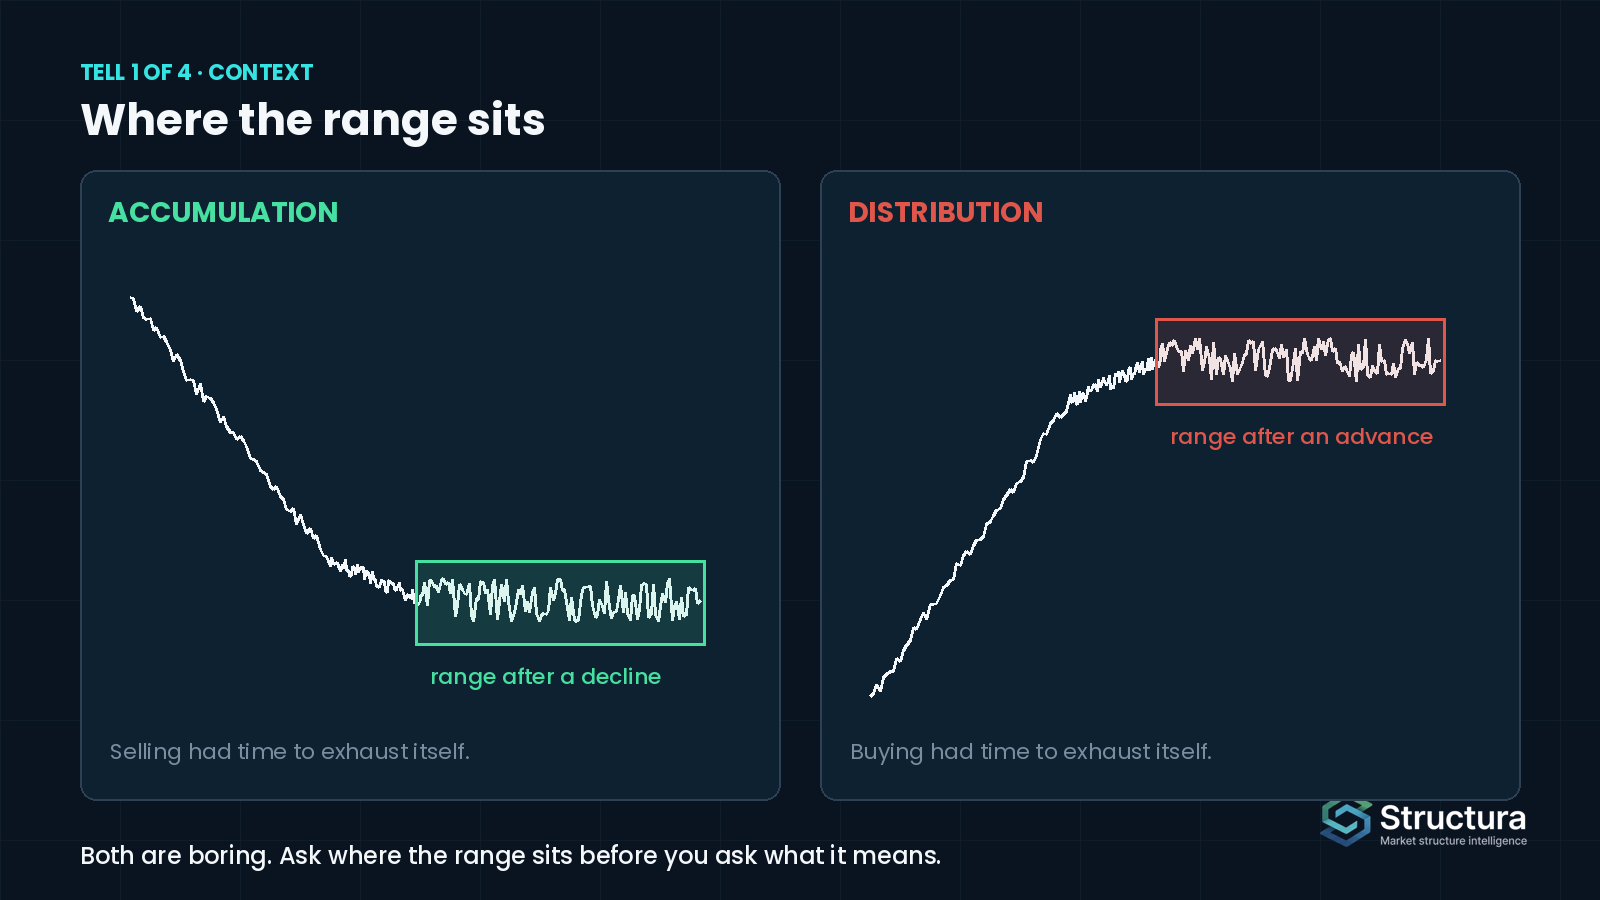
That sounds obvious until you watch people call a range near the top of a two-year rally "a consolidation before the next leg". It might be. But a range at a high has more candidates for distribution than a range at a low, and the honest read starts there, not with a prediction. Ask where the range sits relative to the move that produced it before you ask what it means.
2. How the edges behave
Inside the range, the two phases treat their boundaries differently.
In accumulation, dips below the range tend to get absorbed: price goes under the support, finds no follow-through, and comes back inside. Sellers who wanted out got out, and someone took the other side. In distribution, it is the rallies above the range that get absorbed: price pokes above resistance, stalls, and comes back in. Buyers who wanted in got in, and someone sold to them.
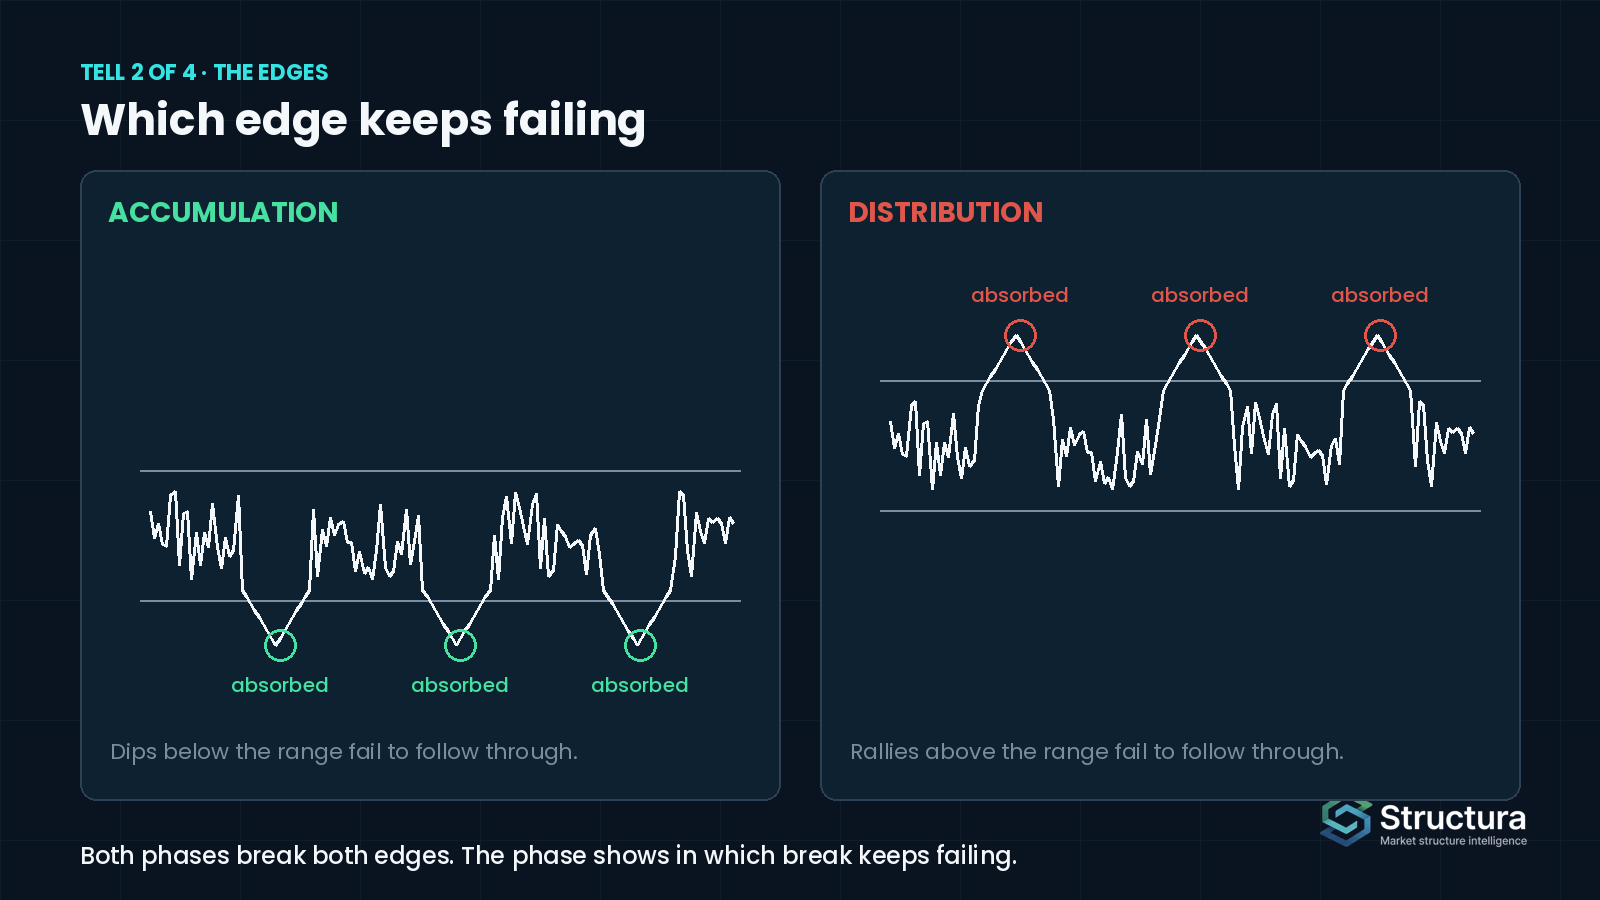
Notice the symmetry. The phase is not revealed by which edge gets broken - both phases break both edges - but by which break fails to follow through. A failed break below is the fingerprint of accumulation. A failed break above is the fingerprint of distribution. One of each tells you nothing yet; a pattern of them starts to.
3. What volume is doing at those edges
This is where the two phases finally separate on something you can measure rather than interpret.
In accumulation, the heaviest volume tends to cluster at the lows of the range - that is where the absorption happens - and the pushes down come on less and less participation. The selling is running out of sellers. In distribution, it is the opposite: the heaviest volume sits at the highs, and the pushes up get thinner. The buying is running out of buyers.
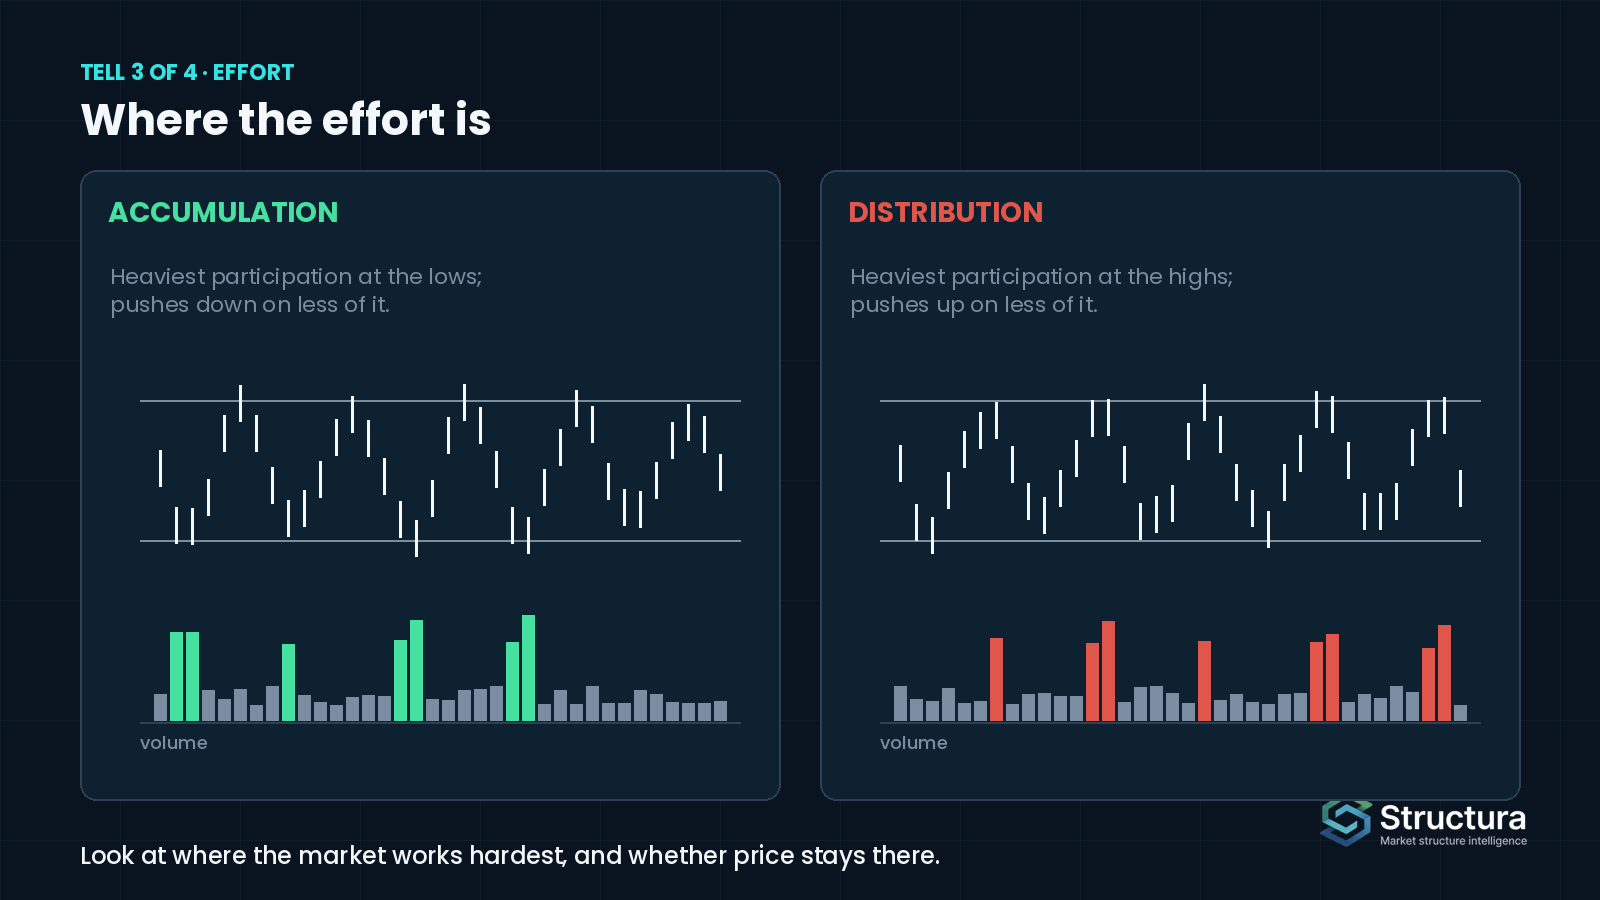
A simple way to keep this straight: look at where the market works hardest. Hard work at the bottom of a range, with price refusing to stay down, reads as accumulation. Hard work at the top, with price refusing to stay up, reads as distribution. The direction of effort tells you who is absorbing whom.
This is also the reason we read volume-weighted price rather than volume alone. Raw volume tells you something happened; the gap between momentum and money flow tells you whether participation followed price or stayed behind it. We wrote about that measurement here.
4. What the range leaves behind
The last tell is the one that outlives the range itself. Accumulation leaves a floor - an area with history, where buyers once showed up in size. If price later returns to it, that return is a test of something real. Distribution leaves a ceiling of the same kind.
This is why our structure layer, Structura Accumulate, does not try to catch the bottom of a range. It records where structural absorption took place and for how long, and it draws a reference under it. Everything below that reference is the zone. Time spent inside it is the accumulation. A return above it is the exit. The layer describes what was built; the market decides what happens next.
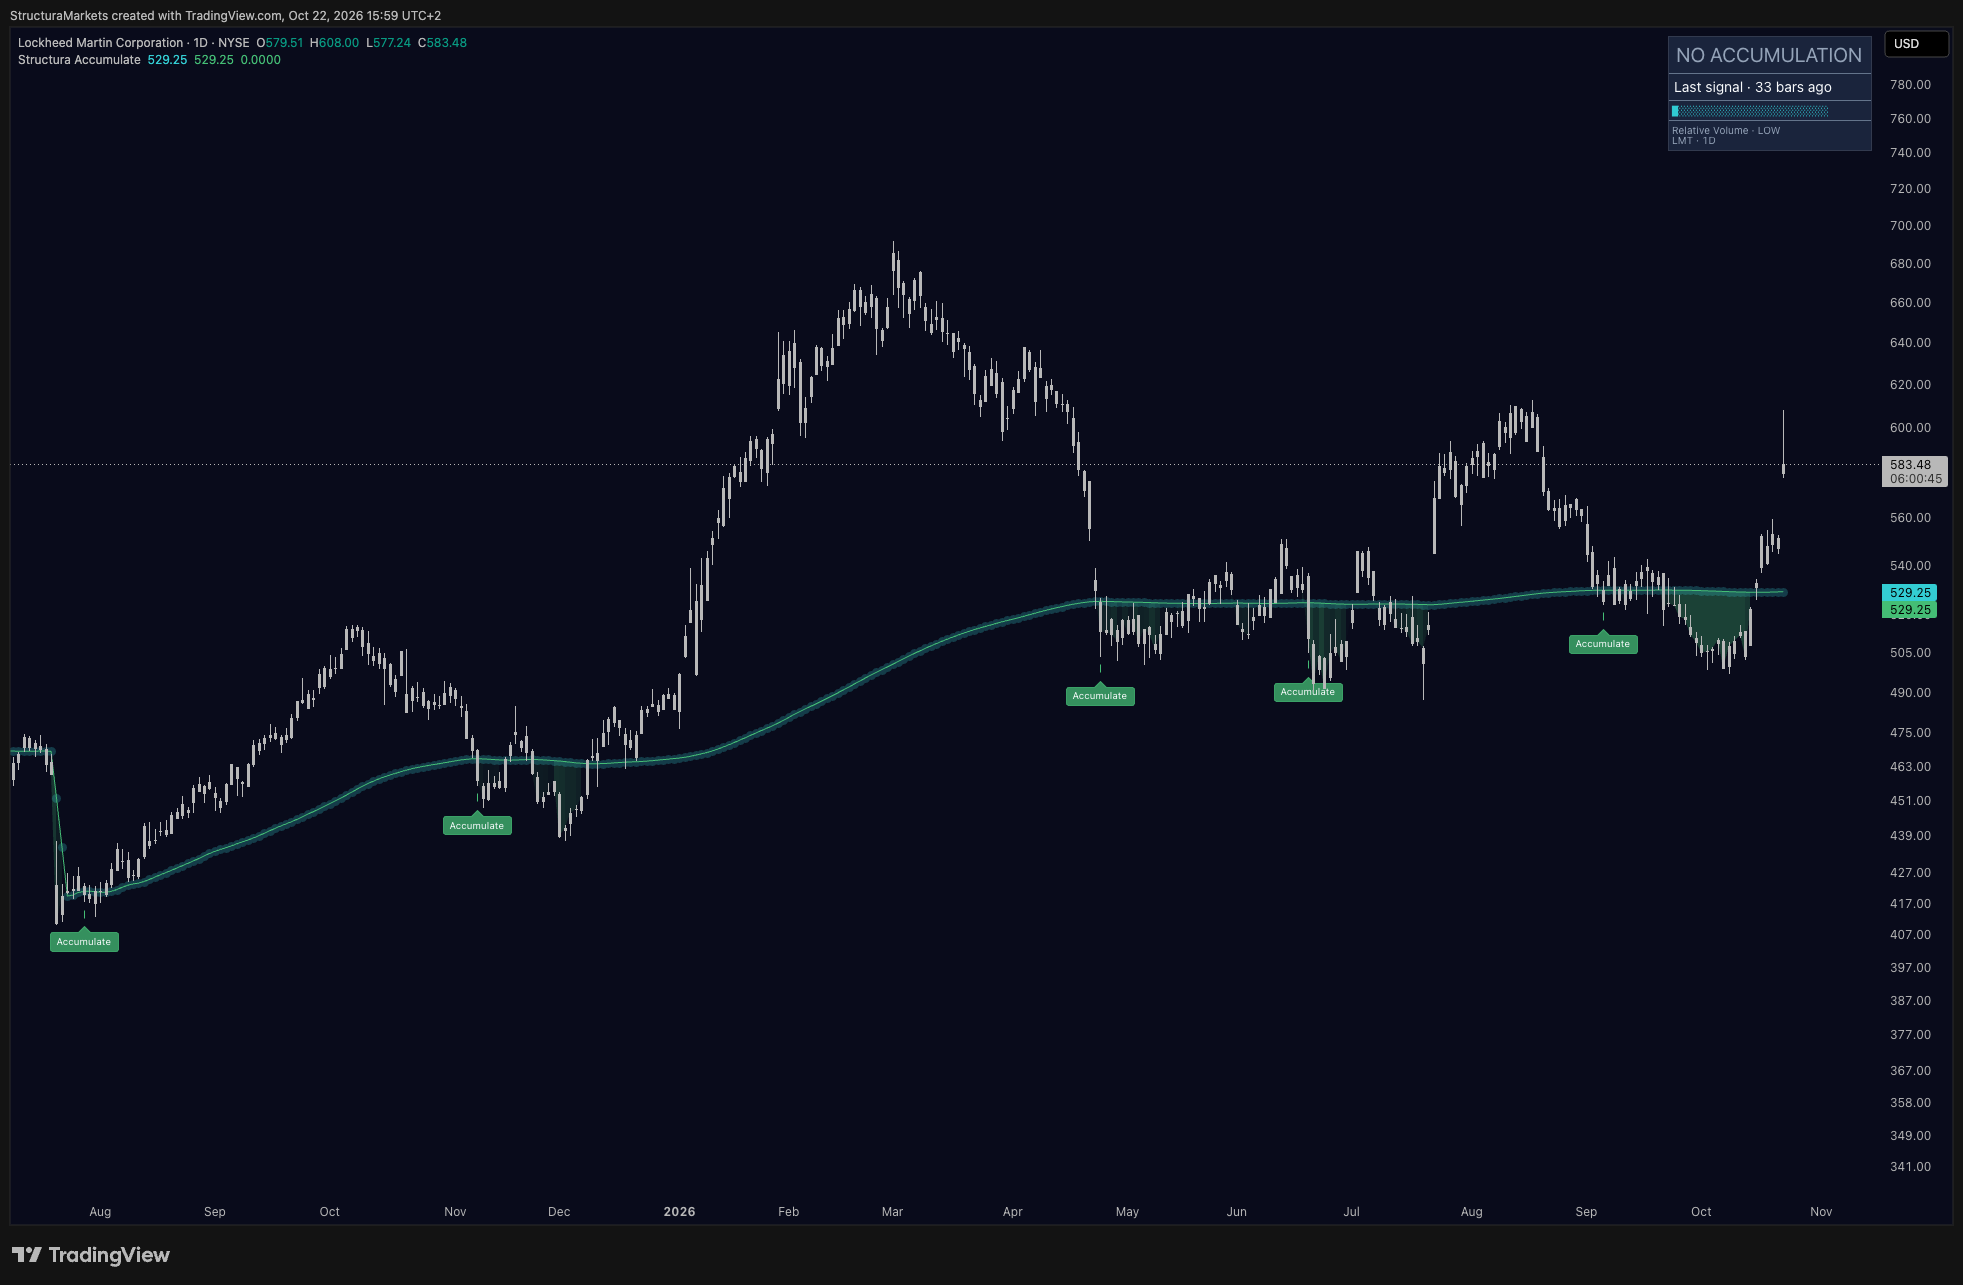
The useful habit here is to stop asking "is this the bottom?" and start asking "is anything being built here?" A range that leaves a floor behind was accumulation, whether or not the first break higher holds. A range that leaves nothing behind - price just drifts out of it - was probably neither; it was a pause.
The honest caveat
None of the four tells is a verdict on its own, and all four can be present in a range that resolves the other way. Accumulation can fail: the floor gets built, and then a larger seller arrives and sells through it. Distribution can fail the same way. The read tells you what the market has done so far, not what it will do - and the acceptance or rejection of the range edges, after the fact, is the only thing that settles it.
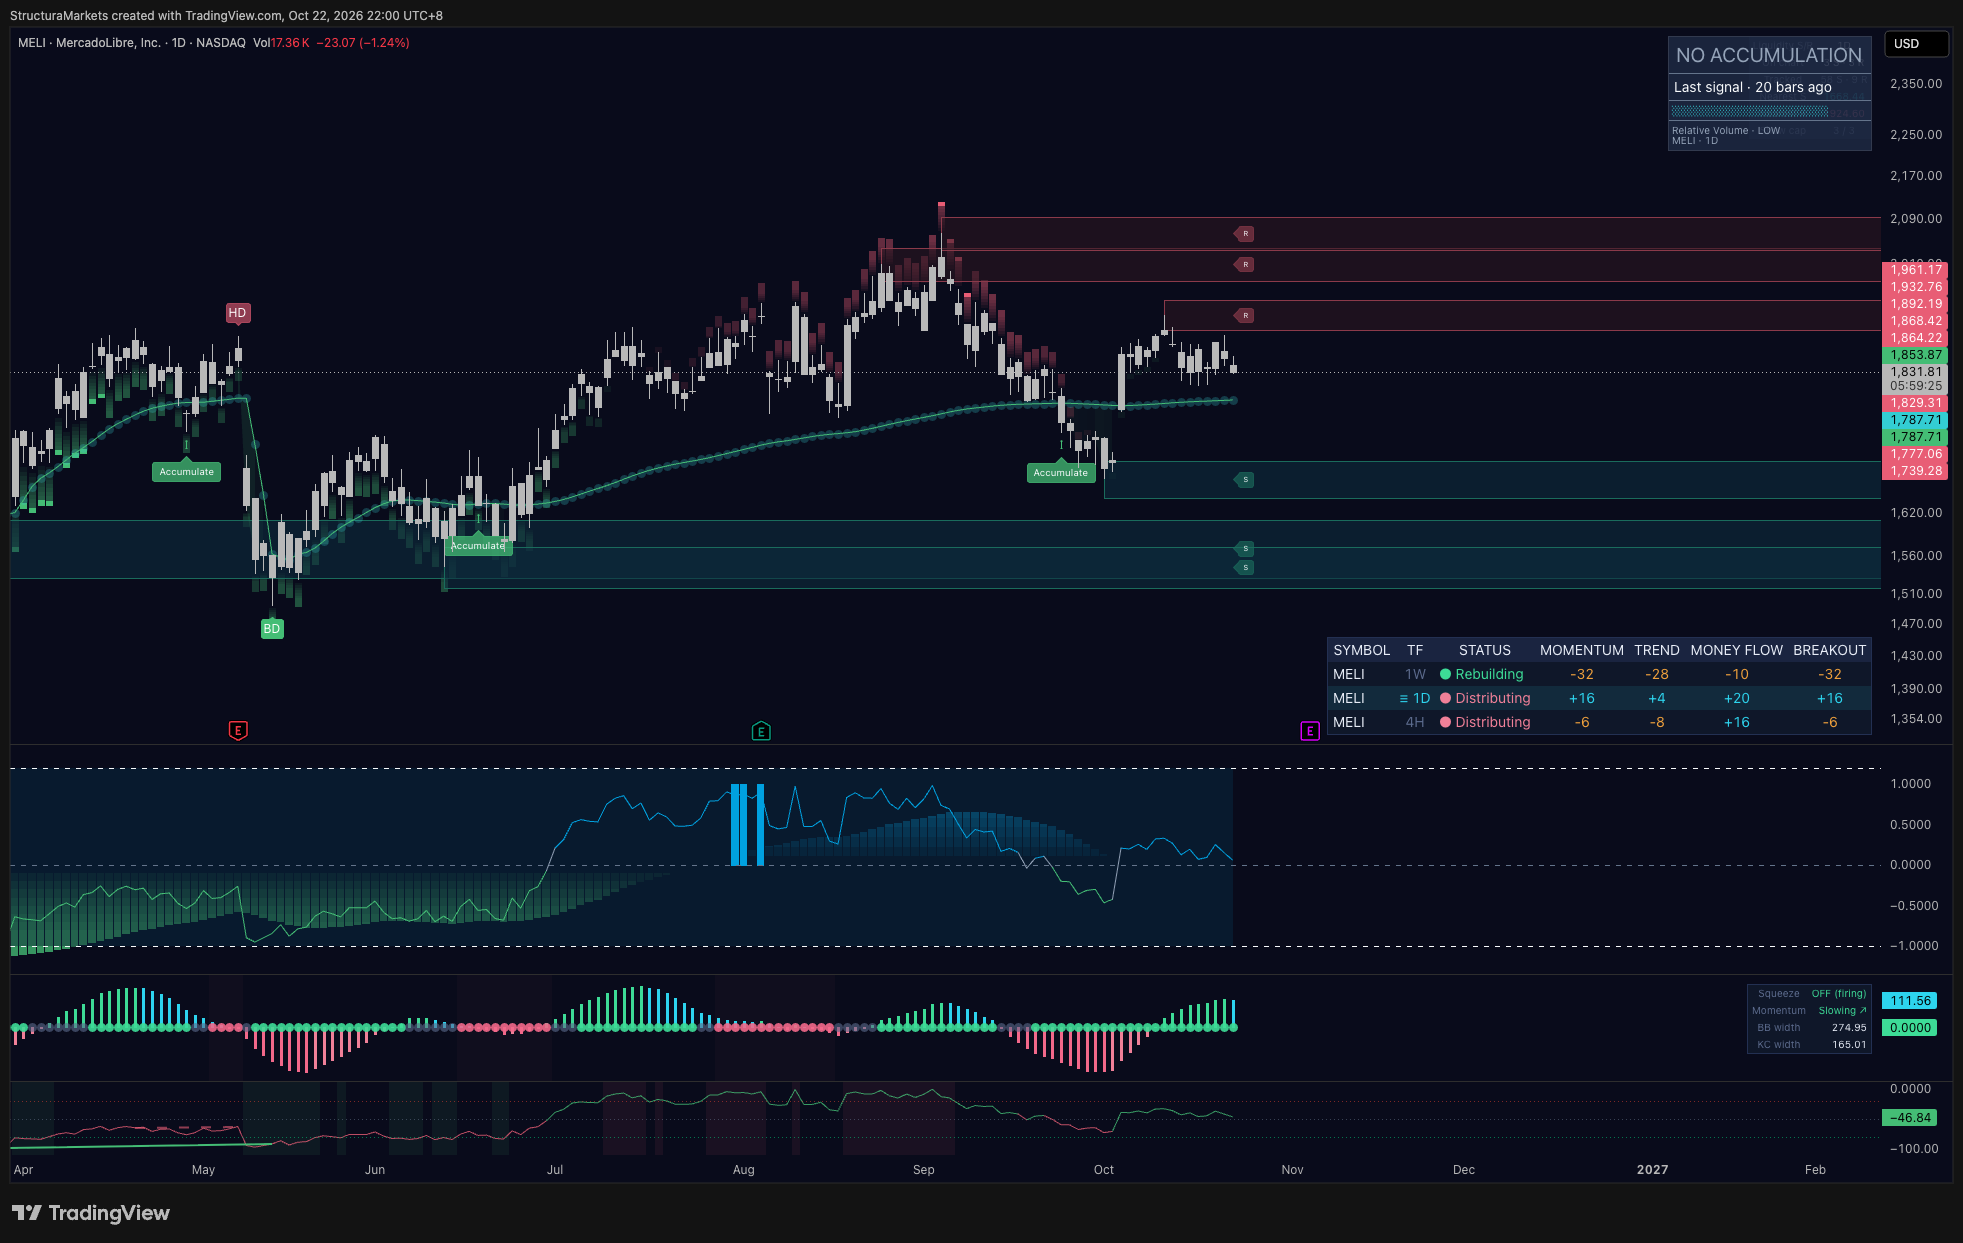
What the four tells do give you is a way to describe the range in the present tense, with a name for what you see, instead of a prediction dressed up as analysis. Where it sits. Which edge keeps failing. Where the effort is. What it is leaving behind. That is enough to read honestly, and it is more than most of the chart commentary you will see on a given day.
One chart, one habit
The next time you are staring at a range, write down the four answers before you write down an opinion. Context, edges, effort, residue. If three of the four lean the same way, you have a read. If they disagree, that disagreement is the read - and it is the signal to wait for the market to resolve the question rather than resolving it for it.
Common questions
How do you tell re-accumulation from distribution?
Both form after an advance, so the first tell - where the range sits - cannot separate them. That leaves the other three: in re-accumulation, breaks below the range edge get bought back quickly and volume dries up on the dips; in distribution, rallies to the top edge fail on heavy volume and the range leaves a lower high behind. If the edges and volume disagree, the honest answer is that the range has not decided yet.
Is this the same as the Accumulation/Distribution indicator?
No. The Accumulation/Distribution line is a volume-based indicator developed by Marc Chaikin that adds or subtracts volume depending on where each bar closes in its range. This article is about the market phases the name refers to - the ranges where large participants build or unload positions - and how to read them on a price chart.
Can you know for sure while the range is still open?
No. The four tells shift the odds; they do not settle the question. The range confirms what it was only when price leaves it, which is why we read the edges and the volume instead of trying to call the outcome early.
Educational market commentary - not financial advice. Structura does not issue signals or predictions.
Read us first in your Google results:
Free on TradingView
Get the free structure layer.
Structura Accumulate marks where the market may be rebuilding structure before the move becomes obvious.
Get the free structure layer